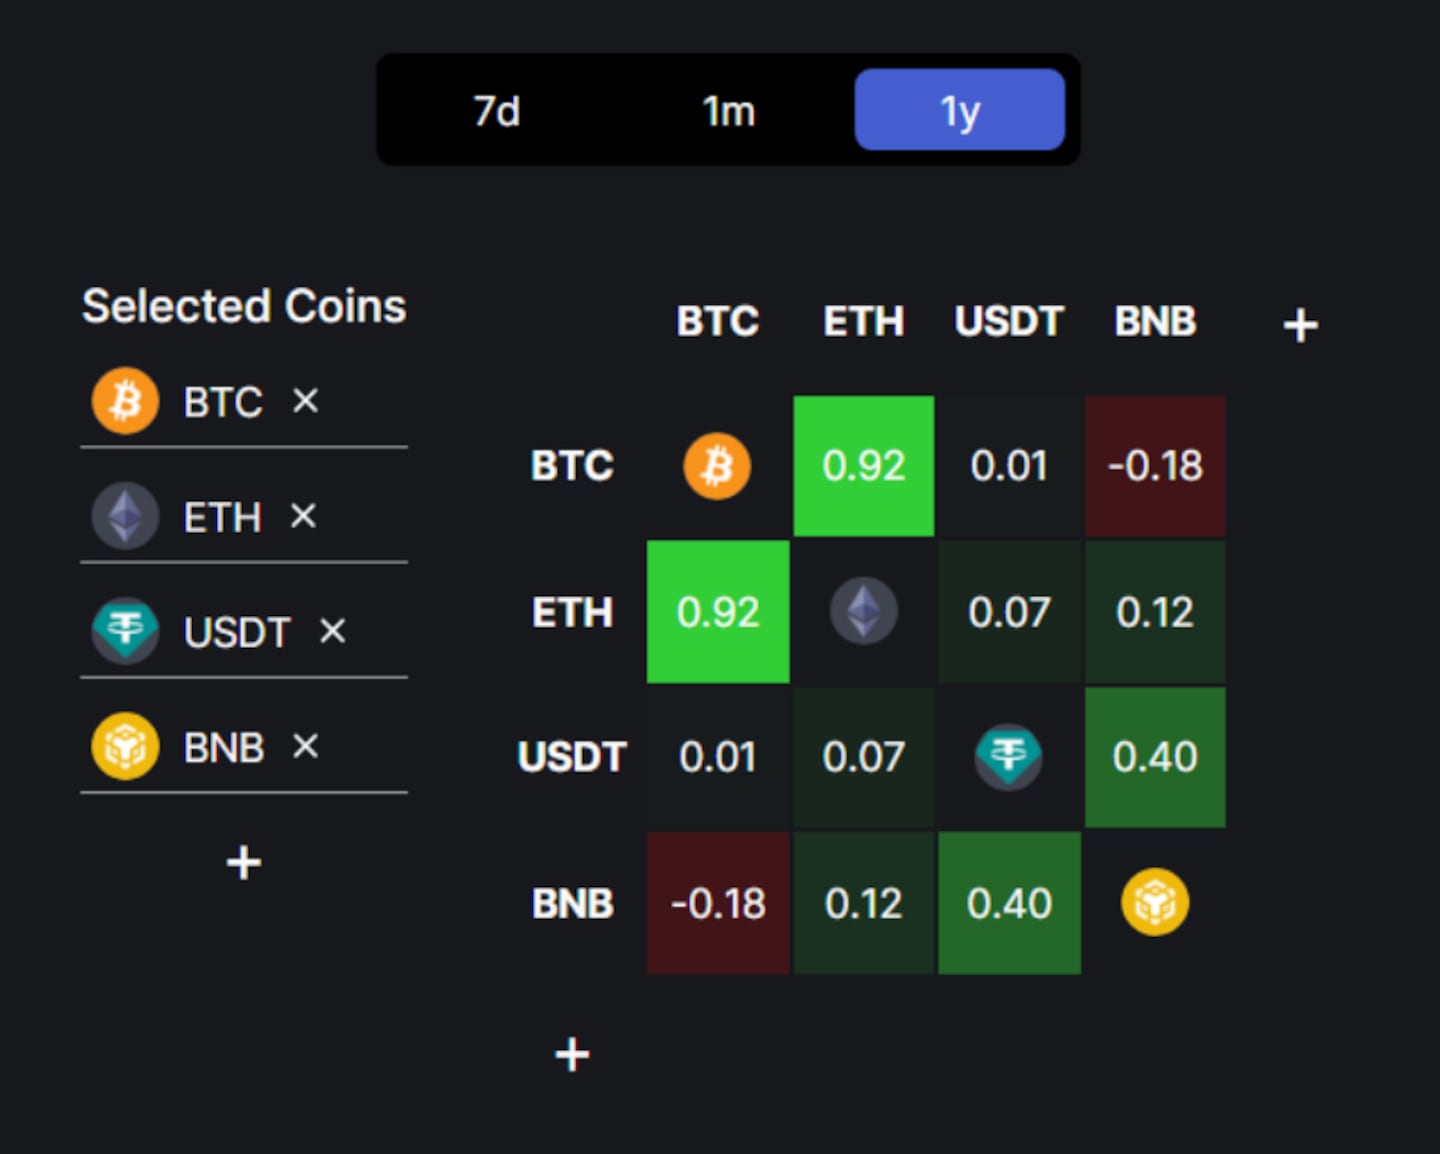
Today we’re looking at how correlation applies to crypto markets, and how tools like DefiLlama’s Correlations Matrix can make it easier to track.
We’ll touch on a few basic concepts for understanding correlation, such as Pearson’s coefficient, and correlation vs causation. While it may sound complicated, DefiLlama makes tracking correlation intuitive.
About correlation — Pearson’s coefficient
In finance, correlation means tracking the relationship between two or more assets. If we approach it like a working question, we could ask, “How do Bitcoin and Ether behave in comparison to each other?”
While the answer may not always be clear upon our first look at the data, we can make things easier on ourselves by dividing relationships into three categories:
- Assets that move together (positively correlated).
- Assets that move in opposite directions (negatively correlated).
- Assets that don’t behave at all like each other (uncorrelated).
The most common way to measure such correlations is with Pearson’s coefficient, and it’s mercifully simple:
- It is measured on a scale from -1 to 1.
- 1 represents a perfect positive correlation.
- -1 represents a perfect negative correlation.
- 0 means the assets have no discernible connection.
Pearson’s coefficient is usually shown to two decimal places. For example, two assets with a 25% positive correlation would have a correlation coefficient of 0.25, while a 100% correlation results in a perfect 1.0.
Conversely, two assets with a 25% negative correlation would have a correlation coefficient of -0.25.
Note that the numbers can’t go over 1 or under -1.
How to use DefiLlama’s Correlations Matrix
Go to the DefiLlama website and click the Correlations tab on the left-hand side of the screen under the Tools section.
Here you’ll find DefiLlama’s Correlations Matrix. It’s a tool that lets users automatically calculate correlation coefficients between multiple crypto assets.
The matrix uses Pearson’s coefficient to display asset correlations from -1 to 1.

Here’s what you can do with it:
- Users can filter data across three time frames: weekly, monthly, and yearly.
- Add more assets by clicking the “+” button on the matrix, and typing your desired crypto asset into the search bar.
- Try a mix of different assets such as Bitcoin, Ether and other more-volatile cryptocurrencies to get a sense of which assets are correlated.
Be careful: When two of the same asset converge on the matrix, it will represent the correlation with the asset’s logo — logically, the correlation of an asset with itself is always perfect (1.0).
How to use correlation
A common phrase used in scientific circles is “correlation does not imply causation.”
It’s important for anyone considering correlations to keep that in mind.
In essence, it means that just because two or more assets may be moving together, it does not mean those movements are directly caused by each other.
Correlation data is useful, but it’s important to understand its limitations.
So, why is correlation data important?
Risk versus diversification, for one. If every asset in your portfolio is positively correlated, it’s likely that a price drop in one asset will translate to a similar drop among all of them.
If your portfolio hosts assets that show little or negative correlation, one asset’s headwinds may not affect your other assets.
This is in step with Modern Portfolio Theory, a popular model used to build out diverse and theoretically resilient portfolios.
Bitcoin, Ether, gold, Nasdaq and beyond
Bitcoin’s correlation to other crypto assets is of great interest to many analysts, and for good reason. As the largest crypto by market capitalisation, its price movements tend to lead the wider market.
Historically, the majority of non-Bitcoin crypto assets, sometimes referred to as altcoins, are positively correlated with Bitcoin, though they tend to be more volatile.
Bitcoin tends to be less volatile due to the fact that it’s the most widely held and well-established crypto asset.
Bitcoin’s closest rival, Ethereum, also has a great deal of pull in the market.
Many leading protocols are built on top of Ethereum, which means that market forces affecting the network may ripple outward and affect the prices of tokens running on it, too.
The talk surrounding Bitcoin’s correlation to other assets is not limited to the crypto sphere.
Exploring the correlations between Bitcoin and commodities like gold, or equities indexes like the S&P 500 or Nasdaq, is also popular.
Bitcoin has at times been hailed as digital gold, though its correlation to the yellow metal is far from consistent.
Bitcoin’s correlation to tech markets is similarly tenuous. US equities showed a strong correlation with Bitcoin from 2020 to 2022, but less so in 2023.
Next steps
- Try out the Correlations Matrix on DefiLlama. Compare a basket of well-known assets or high-volatility altcoins. Notice any patterns?
- Read this and other correlation-focused DL News articles to see how they can apply in real-world markets.


