


Executive summary: DeFi in 2025

In 2025, DeFi moved further away from a cycle-defined speculative arena and closer to a durable financial system with recognisable primitives, maturing market structure, and increasingly institutional-grade infrastructure. Growth was real, but it was uneven. A handful of sectors reached escape velocity and began to resemble scaled financial businesses, while others failed to sustain product market fit once incentives faded and risk was repriced.
Across the report, a coherent picture emerges. Stablecoins became the monetary base layer for onchain activity. Trading infrastructure converged into an interconnected stack that links issuance, spot, derivatives, and event-driven markets. Credit and yield matured into a more fixed-income-like ecosystem built on stablecoin collateral and tokenized real-world assets. Execution quality improved as routing shifted toward private channels, solver-based systems, and more industrial MEV supply chains, which reduced some user-facing harm while concentrating power in fewer intermediaries. Governance and token design professionalised, proposal cadence slowed, delegation intensified, and value capture became more explicit. Meanwhile, treasury capacity, both at the DAO level and in public equities, proved to be a major determinant of who could endure volatility and keep building.
The year’s central theme was maturation through specialization. Liquidity, revenue, and user activity increasingly accrued to systems that delivered reliable execution, credible risk controls, and clear economic models. Where the foundation was weaker, 2025 imposed a repricing.
Stablecoins became core financial infrastructure
Stablecoins are no longer a peripheral crypto product. In 2025, they functioned as the settlement layer connecting payments, trading, collateralisation, and treasury operations into one interoperable system. After the post-Terra contraction, supply resumed sustained expansion, and stablecoin settlement volumes continued to rival the scale of the largest global value-transfer networks.
The chain distribution reinforced a two-pole structure. Ethereum remained the dominant DeFi-native monetary base, anchored by security-first settlement preferences and institutional-grade integrations. Tron continued to function as a high-throughput transfer rail, with stablecoin usage shaped more by exchange and payment flows than DeFi composition. A second tier of growth formed in high-velocity trading environments, where stablecoins increasingly behaved like working capital for issuance funnels, spot routing, and derivatives margin.
Issuer diversity expanded, but concentration remained intact. The market became broader at the edges, yet the core stayed dominated by the largest reserve-backed issuers. The practical implication for the rest of DeFi is straightforward. If stablecoins are the unit of account and the primary collateral form, then the monetary system’s health is increasingly tied to issuer behavior, regulatory posture, and integration depth, not just onchain mechanics.
Value capture expanded, but concentration stayed structurally high
Revenue growth broadened across major DeFi verticals in 2025, but value capture remained concentrated. A relatively small set of protocols continued to take the majority share of fees and revenue, with stablecoin issuers sitting far above the application layer. This concentration is not a failure of competition, it is a reflection of how reserve-based monetary models scale and how sticky liquidity and distribution advantages can be.
Below the issuers, the competitive map changed meaningfully. Perpetuals established themselves as a durable revenue engine with increasingly mature behavior, less dependent on market direction and more tied to continuous risk transfer and execution quality. Primary issuance rails emerged as a major standalone category, monetizing attention, distribution, and entertainment rather than traditional liquidity provision. DEXs and aggregators grew in absolute terms, but their business performance remained more tightly linked to market activity and volatility. Lending and yield expanded more gradually, with a visible shift toward more structured and institutional-facing designs.
A key enabling condition sat underneath all of this. Execution became cheaper. Falling infrastructure costs allowed applications to scale further than previous cycles, reinforcing the shift from base-layer value capture toward application-layer economics.
The trading stack converged into a continuous system
The structure of onchain markets changed fundamentally in 2025. What previously looked like separate layers, swapping on AMMs, trading perps, minting tokens on new rails, and speculating on events, began to behave like a single connected trading system. Liquidity rotated faster across layers, catalysts propagated more quickly, and user behavior increasingly responded to execution quality and distribution rather than chain identity alone.
Spot markets continued their migration onchain. DEX share of global spot trading rose materially, but the more important change was competitive and architectural. Dominance diluted across more venues, and the user experience continued to abstract away decision-making. The market moved from manual venue selection, to aggregation, to intent-based execution, where users express an outcome and solver networks compete to deliver best execution across venues and across chains. Over time, that pushes the system toward a world where routing and settlement become invisible, and where market structure risk shifts from “which AMM” to “which execution intermediaries.”
Perpetuals matured even faster, and the mechanism of maturation was microstructure. The sector rotated away from early vault-based or vAMM-style designs and toward exchange-grade matching, deeper orderbooks, unified collateral, cross-margin, and more robust liquidation pathways. In practice, perps liquidity increasingly gravitated toward execution-first environments and hybrid architectures that prioritize throughput and predictable fills. The key competitive axis moved from chain branding to performance, risk management, and capital efficiency.
Issuance rails functioned as the ignition layer of speculative cycles, onboarding users at scale and feeding downstream spot and derivatives activity. Prediction markets expanded into a catalyst and information layer, increasingly shaping positioning behavior through probability signals that traders translate into hedges and directional bets elsewhere in the stack.
The net effect is a loop. Issuance captures attention. Attention becomes spot flow. Spot flow pulls derivatives demand. Event probabilities modulate positioning and funding dynamics. This is not just more activity, it is a more integrated market system.
Credit and yield matured, restaking repriced, RWAs became core collateral
On the balance-sheet side of DeFi, 2025 was defined by maturation and repricing.
Lending expanded and remained concentrated in a small number of dominant venues, with market share shifting toward platforms perceived as operationally strongest and most institutionally legible. The deeper change was not only who held deposits, but how efficiently platforms converted deposits into productive credit. Market design, risk calibration, and borrower demand increasingly determined fee outcomes.
Yield markets evolved more in structure than in size. Duration trading matured, and “onchain fixed income” became more legible through stablecoin-centric collateral and more structured rate exposure. Pendle remained central to active rate expression, but competition increased, and the market’s collateral composition tilted toward layered, yield-bearing stablecoin structures. That shift improved composability and predictability for allocators, while also creating new forms of concentration risk around a narrow set of stablecoin and synthetic-yield ecosystems.
Liquid staking held up as a durable capital base, with gradual share shifts away from early incumbents and toward exchange-linked or more institutionally packaged wrappers. Restaking moved in the opposite direction. As incentives normalized, the sector faced a tougher risk-return trade. With less obvious incremental reward for added complexity, capital rotated out and consolidated into the most established venues. The story shifted from points-driven growth to explicit security and slashing risk, which is a very different equilibrium.
Real-world assets moved from niche to core yield and collateral infrastructure. Tokenized Treasuries, private credit, and institutional fund wrappers scaled quickly, and leadership increasingly rotated toward recognizable asset managers and regulated issuers. The important takeaway is not simply “RWAs grew,” it is that DeFi’s collateral stack is becoming more dollar-native, more institutionally distributed, and more aligned with familiar fixed-income primitives.
Execution quality improved, market structure centralized
MEV and execution in 2025 looked less like an adversarial byproduct and more like an institutional supply chain. Across major ecosystems, value extraction became more mediated by builders, private routing, RFQ layers, solver markets, and auctions. User outcomes improved in many cases, especially for larger trades on core assets, but the system became more dependent on a small number of intermediaries.
On Ethereum, toxic MEV did not disappear, but it showed signs of stabilizing rather than expanding mechanically with DEX usage. More flow moved into protected pathways, including private routing and solver-mediated execution, which dampened some user-visible harm. On BNB Chain, MEV became more systematized through builder-led production, with strong concentration among a small set of builders. On Solana, MEV remained validator-centric through tip-based auctions and massive bundle throughput, with competition intensifying even as economic density normalized after early-year volatility.
The tradeoff entering 2026 is clear. The market is getting better execution, but it is doing so by routing a growing share of economically sensitive flow through narrower, more industrial rails. That improves performance and often reduces slippage, yet it increases concentration risk, reduces pre-trade transparency, and makes market integrity more dependent on the behavior and resilience of a small set of service providers.
Governance, token design, and treasuries shifted toward professionalization and payouts
Airdrops remained a primary user acquisition mechanism, but their onchain outcomes continued to show a consistent reality: broad recipient counts rarely translate into broad economic ownership. Allocation design differentiates sharply between tiers, and claim timing has become a key lever that shapes how supply enters markets and how price discovery forms.
DAO governance moved from high-frequency experimentation toward professionalized control. Proposal counts fell, participation thinned, and delegation became more central. The economic weight of decisions increased even as the number of decisions declined. Governance increasingly functioned as a control layer for risk management, value capture activation, and crisis response, rather than a forum for continuous iteration.
Treasury capacity became a structural separator. A small set of DAOs held the bulk of observable onchain treasury capital, while the long tail operated with limited runway. Composition also bifurcated. Many large treasuries remained heavily exposed to their own tokens, preserving optionality for incentives but tying operating capacity to token price. A smaller subset held meaningful stablecoin buffers and diversified reserves, enabling steadier operations and more credible institutional posture.
Token economics took a meaningful step forward. More protocols adopted explicit value capture through revenue sharing, burns, buybacks, or staking-linked distribution. The market increasingly rewarded designs that paired payouts with disciplined issuance, distinguishing sustainable models from older structures where tokens mainly represented governance narratives.
Closing thoughts
By the end of 2025, DeFi looked less like a single market and more like a layered financial system. Stablecoins formed the monetary base. Trading converged into a continuous stack spanning issuance, spot, derivatives, and event-driven markets. Credit and yield matured toward stablecoin-native, fixed-income-like structure underpinned by tokenized real-world assets. Execution improved through private routing and industrial intermediaries, while market power concentrated. Governance and token design professionalized, payouts normalized, and treasury capacity became an increasingly decisive advantage.
The year’s defining movement was structural differentiation. The winners were not simply the protocols with the most users or the most TVL, but those with durable execution, credible risk frameworks, and clear economic models that still function when incentives fade.
Stablecoins

Stablecoins are no longer a peripheral crypto product. In 2025, they became one of the primary settlement assets across payments, remittances, DeFi, institutional transfers and onchain treasury operations. In short, what began as a trading tool has evolved into a core monetary layer used across dozens of blockchains.
After nearly two years of contraction following the collapse of Luna’s TerraUSD in 2022, the sector entered a new expansion cycle. In November 2024, the total stablecoin market capitalisation broke its previous record of $185 billion and accelerated sharply from there, rising to $305 billion by early December from $204 billion at the start of the year a 50% increase within 12 months.
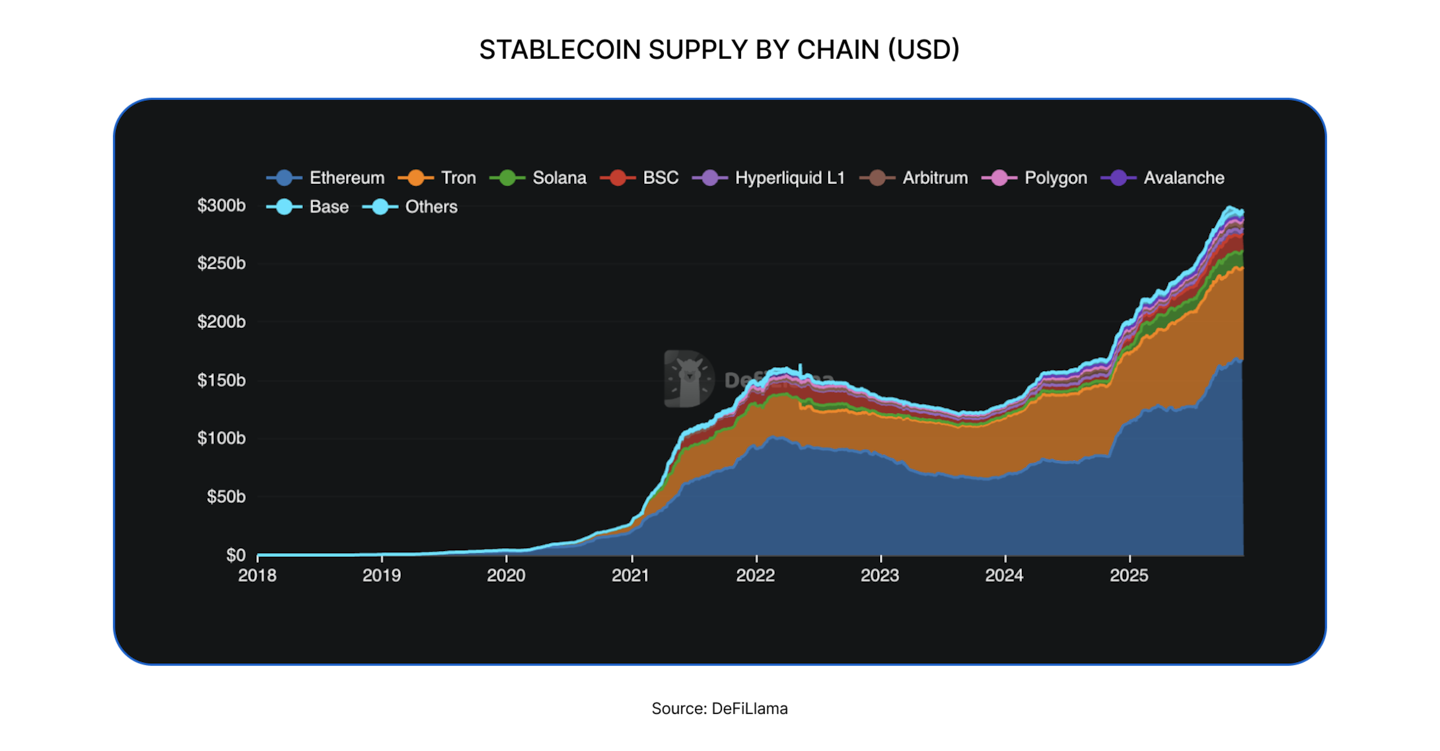
At the chain level, Ethereum reinforced its position as the dominant stablecoin environment, maintaining roughly 55% of total supply and adding $50 billion in new issuance, driven primarily by institutional flows, tokenisation, and RWA infrastructure prioritising security and settlement guarantees. Tron, by contrast, continued to consolidate its role as the global remittance chain, growing its supply by 34% and adding $25 billion — showingclear evidence that demand for low-cost, cross-border transfer rails remains strong. Together, Ethereum and Tron account for 81% of all circulating stablecoins, declining a modest 3% over the year despite rapid expansion on other chains.
Solana expanded its stablecoin supply by more than 170%, driven not only by the memecoin cycle, which now represents around 5% of DEX activity, but also by rising activity in onchain perpetuals, payments and remittance flows. Binance Smart Chain and Hyperliquid Layer 1 followed similar trajectories, each recording triple-digit growth. On Hyperliquid, USDC emerged as the dominant margin and settlement asset. On BNB Chain, the launch of Four.meme, followed by Binance Alpha, a native token distribution program integrated directly into the Binance ecosystem, catalysed a renewed memecoin boom and sharply increased demand for stablecoin liquidity.
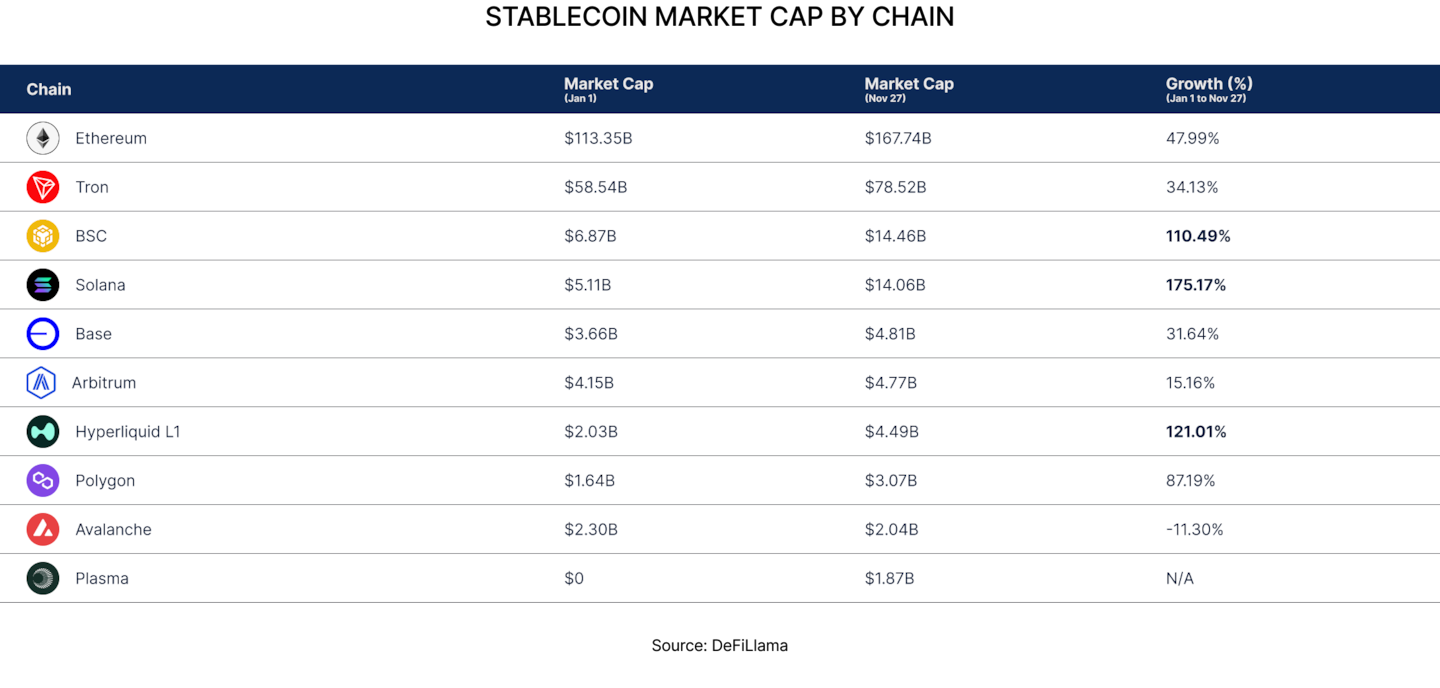
The number of stablecoin issuers and assets also grew materially throughout 2025. In early January, DefiLlama tracked 161 stablecoins, with 36 having a market cap above $50 million. By December, that number had increased to 214, with 51 exceeding the same threshold. At the top end, 18 stablecoins now surpass $1 billion in supply, up from 11 at the start of the year.
The two top stablecoins, Tether’s USDT and Circle’s USDC, still account for roughly 85% of the total supply. USDT expanded by 34% over the year, while USDC grew by more than 75%, driven by its increasing role as a chain-agnostic, easy-to-integrate payment currency.
Yield-bearing models, bank-issued tokens, fintech-native stablecoins and regional currency products all accelerated. Assets such as PYUSD (PayPal), RLUSD (Ripple), USDTB (BlackRock), USD1 (World Liberty Finance), USDF (Falcon), and USDG (Ondo) grew from negligible supply to multi-billion-dollar levels in a matter of months. Most of these issuers already operate in regulated financial environments and serve large, established user bases, which has enabled rapid scaling. Their entry into the market marks a clear shift: institutions are no longer observing the stablecoin sector from the sidelines, but are actively participating in it.

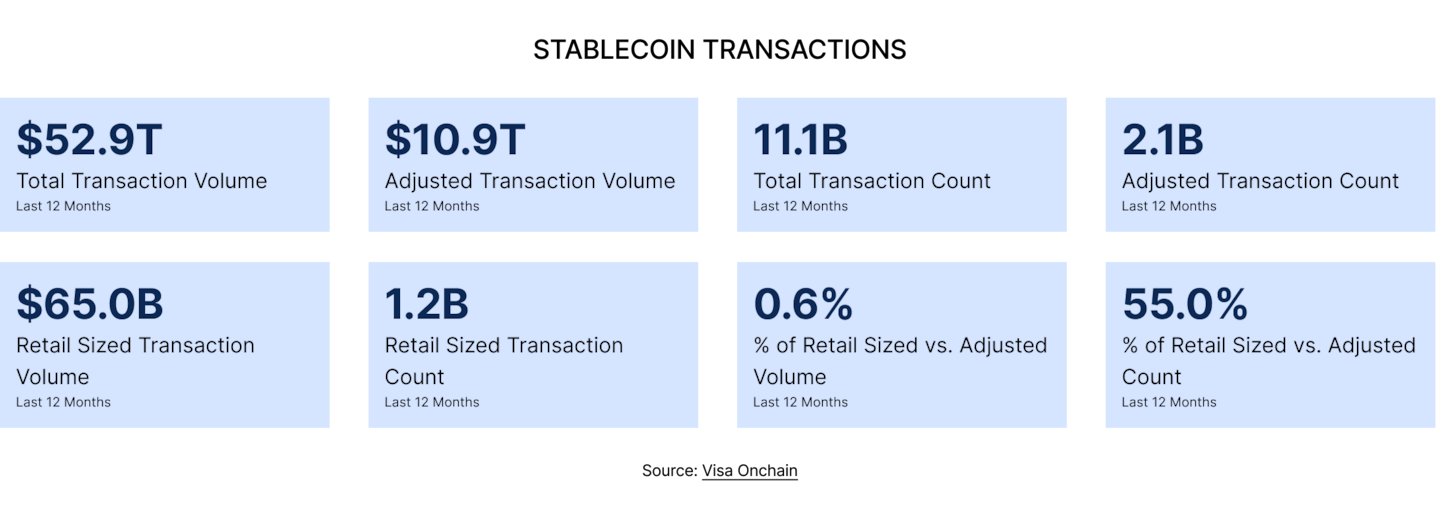
Stablecoin settlement volume underscores how deeply they are now embedded in real-world payments. In 2024, stablecoins settled more than $27 trillion in transaction value, surpassing Visa and Mastercard combined. Over the past twelve months, that figure nearly doubled to $52.9 trillion, placing stablecoins among the largest settlement systems globally.
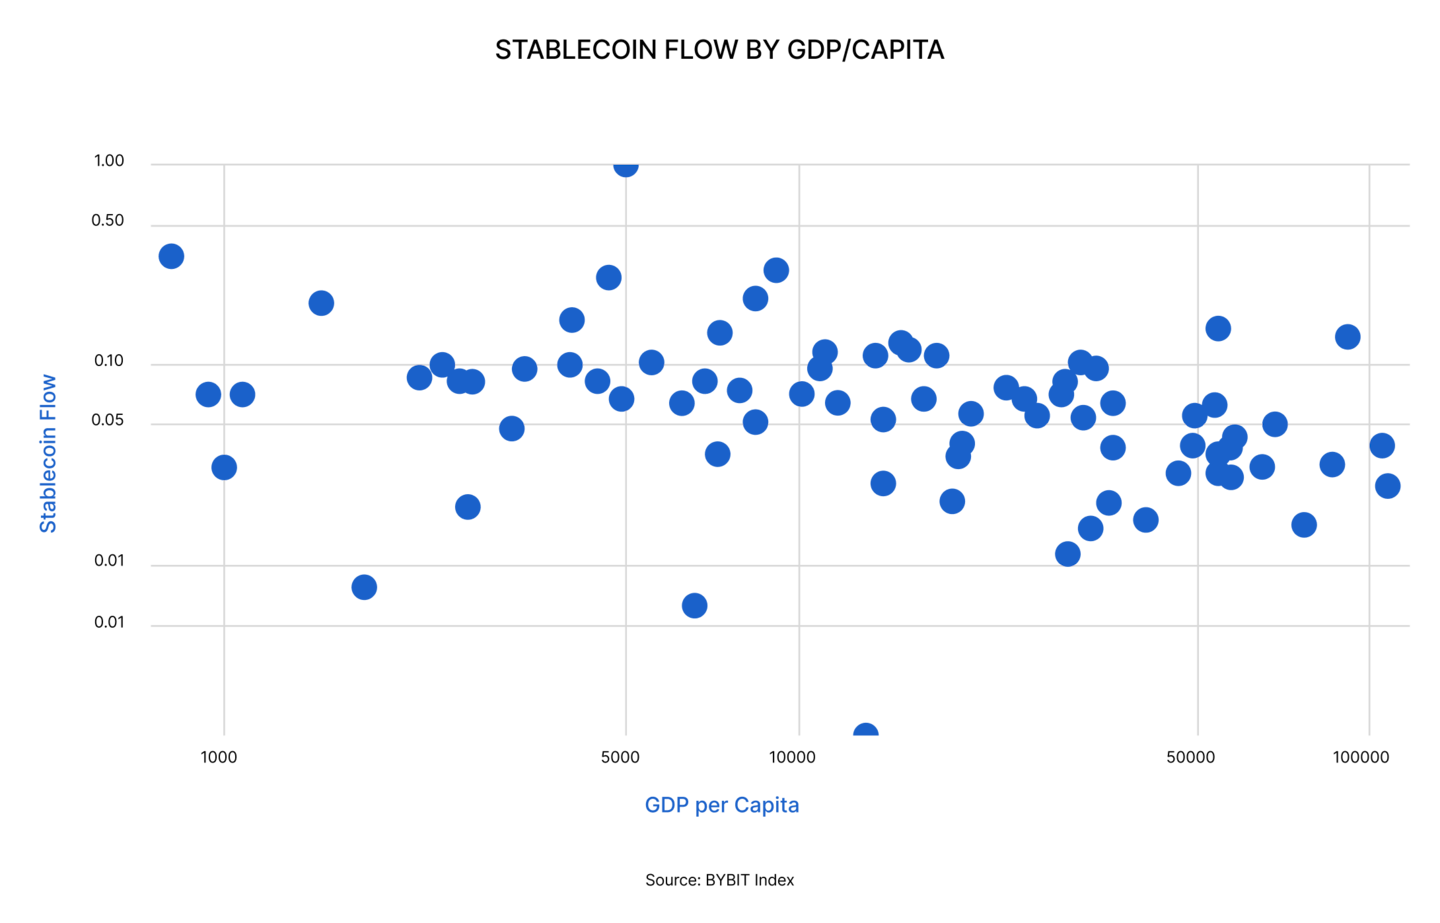
Notably, stablecoin adoption is not tied to national wealth. When stablecoin flow is analysed relative to GDP per capita, there is almost no correlation. Usage is widespread across advanced and emerging markets alike, but for different reasons. In countries facing instability or limited banking access, such as Nigeria or Ukraine, stablecoins primarily serve as remittance tools and secure stores of value. In wealthier economies, they are used as financial instruments, enabling efficient access to crypto markets, liquidity pools and yield-generating products. This bifurcation reflects the universal appeal of stablecoins: they solve completely different problems across completely different contexts, yet rely on the same underlying infrastructure.
The Regulatory Shift: Clarity Unlocks Institutional Adoption
The resurgence of stablecoins in 2025 did not arise from market momentum alone. It was the result of a structural shift driven by regulation, institutional engagement and macroeconomic forces aligning for the first time since the sector emerged.
A central driver was the GENIUS Act in the United States, which established the first comprehensive federal framework for dollar-backed stablecoins. It set strict 1:1 reserve requirements, mandated audited transparency standards and introduced a dual state-federal licensing model that traditional financial institutions could operate within. For the first time, the market gained a clear distinction between fully collateralised and regulated issuers versus experimental designs, a distinction institutions had been waiting for since 2022.
This shift was mirrored across multiple jurisdictions. In the European Union, the Markets in Crypto-Assets Regulation framework, MiCA, introduced harmonised rules for issuance, redemption and reserve composition, creating a predictable operating environment for euro-denominated stablecoins. Hong Kong implemented a licensing regime for issuers, while Singapore advanced rapidly with tokenised deposit infrastructure. Across the Gulf, particularly in the UAE, regulators began competing to attract stablecoin and tokenisation businesses. In short, major jurisdictions are no longer resisting adoption, they are shaping it.
Regulatory alignment coincided with the maturation of the products themselves. Over the past three years, leading stablecoins demonstrated resilience through bank failures, liquidity shocks, interest-rate volatility and major crypto drawdowns. Fully collateralised models such as USDT and USDC, as well as the increasingly popular RWA-backed or crypto-backed designs, proved robust under stress. The market internalised the lessons of the Luna collapse, and undercollateralised models gradually lost relevance.
As a result, banks, corporations and financial technology companies moved from pilots to real deployment. PayPal expanded PYUSD issuance, BlackRock’s USDTB attracted billions in demand, and Ripple’s RLUSD scaled rapidly across several chains. Stripe integrated stablecoin settlement into its payments stack, enabling merchants and platforms to accept and move digital dollars directly. At the same time, corporate treasurers, onchain lenders, market makers and remittance providers shifted a growing share of their operations to stablecoin rails.
The macro environment amplified this transition. Elevated US interest rates increased the appeal of fully backed stablecoin models whose reserves are invested in short-term Treasury instruments. Tether, for example, has become one of the largest holders of US Treasury bills globally. This environment also supported the emergence of new US-backed stablecoin designs, while yield-bearing stablecoins developed to pass these returns directly to users. At the same time, inflationary pressures across emerging markets pushed consumers and businesses toward dollar-denominated assets, accelerating adoption where local currencies remain fragile.
By 2025, the effects of these forces were visible in the data: stablecoin supply reached record highs, institutional issuers entered the market at scale and settlement volumes surpassed traditional payment networks.
The Technology Shift: Stablecoins Become an Infrastructure Layer
Regulatory clarity laid the foundation for stablecoin expansion, but technology played an equally important role as stablecoins became also the infrastructure rather than just assets.
USDC is a major player in this transition. Circle’s multichain strategy and the adoption of CCTP turned USDC into a native, burn-and-mint asset that can move seamlessly across networks without relying on conventional bridges. Liquidity is unified, fragmentation is reduced and applications can settle across multiple chains with the same token standard. For institutions, this model resembles a global settlement network allowing fintechs, exchanges and payment platforms to treat stablecoins as infrastructure. A similar transition is underway with USDT. The launch of USDT0 through LayerZero messaging allows Tether’s supply to be treated as chain-agnostic, eliminating one of the largest sources of operational friction in the market: fragmented liquidity.
At the same time, a new class of networks is emerging that redefines settlement around stablecoins entirely. Take Plasma:a chain built from first principles to support stablecoin flows, with stablecoins functioning as the native asset rather than an add-on. In a few months, it grew to nearly $2 billion in circulating supply, driven by an environment optimised for high throughput, low fees and predictable settlement. This design mirrors the success of Tron, which proved that specialising around a single financial primitive can sustain massive daily volume and meaningful fee revenue. Plasma is not alone, other projects are following the same direction like Stable, Arc (Circle) and Tempo (Stripe) all signal that stablecoin-first settlement layers are becoming a strategic priority.
The Usage Shift: Payments, Safety and Yield
Stablecoins entered a new phase in 2025. What began as a trading convenience now operates at the centre of payments, remittances and onchain finance. Users leaned toward safer fiat-backed assets, while institutions embraced yield-bearing models that turned digital dollars into productive capital. These shifts reshaped stablecoin behaviour, creating adoption patterns grounded in real economic use rather than speculative cycles.
Payments, Remittances and Financial Instruments
As real-world integrations expanded throughout the year, stablecoins increasingly moved beyond passive storage and into everyday payments. The growth of crypto cards, merchant onramps and direct checkout options made stablecoins far easier to spend. Examples abound, with Shopify and Stripe now supporting crypto-based payments, while the number of crypto cards surged throughout the year.
This broader usability naturally reinforces stablecoins’ role in remittances, one of their most persistent and necessity-driven use cases. The speed and low cost of cross-border settlement directly address geopolitical and banking frictions. In Ukraine, stablecoins provide reliable access to funds amid ongoing disruptions. Workers in the UAE use them to avoid high remittance fees, and in Nigeria they have become a trusted alternative to fragile local banking systems. These flows are clearly not speculative, they respond to everyday financial realities.
At the same time, stablecoins continued to serve as the reference asset for onchain finance. They remain the preferred unit for trading, liquidity provision and collateral across DeFi, primarily because of their price stability.
As a result, stablecoins increasingly function as the core settlement and accounting layer linking payments, transfers and financial markets within a single system.
A Preference For Fiat-Backed Stablecoins
The preference for fully collateralised, fiat-backed stablecoins continued to strengthen. USDT and USDC account for roughly 85% of total supply, a dominance that has barely eroded the proliferation of new issuers. The reasons are straightforward: post-Luna risk aversion, clearer regulatory standards and stronger institutional participation have all reinforced demand for audited, conservative designs. As corporates and financial institutions deepen their use of digital dollars for settlement and liquidity management, this preference for safety has become a structural feature of the market.
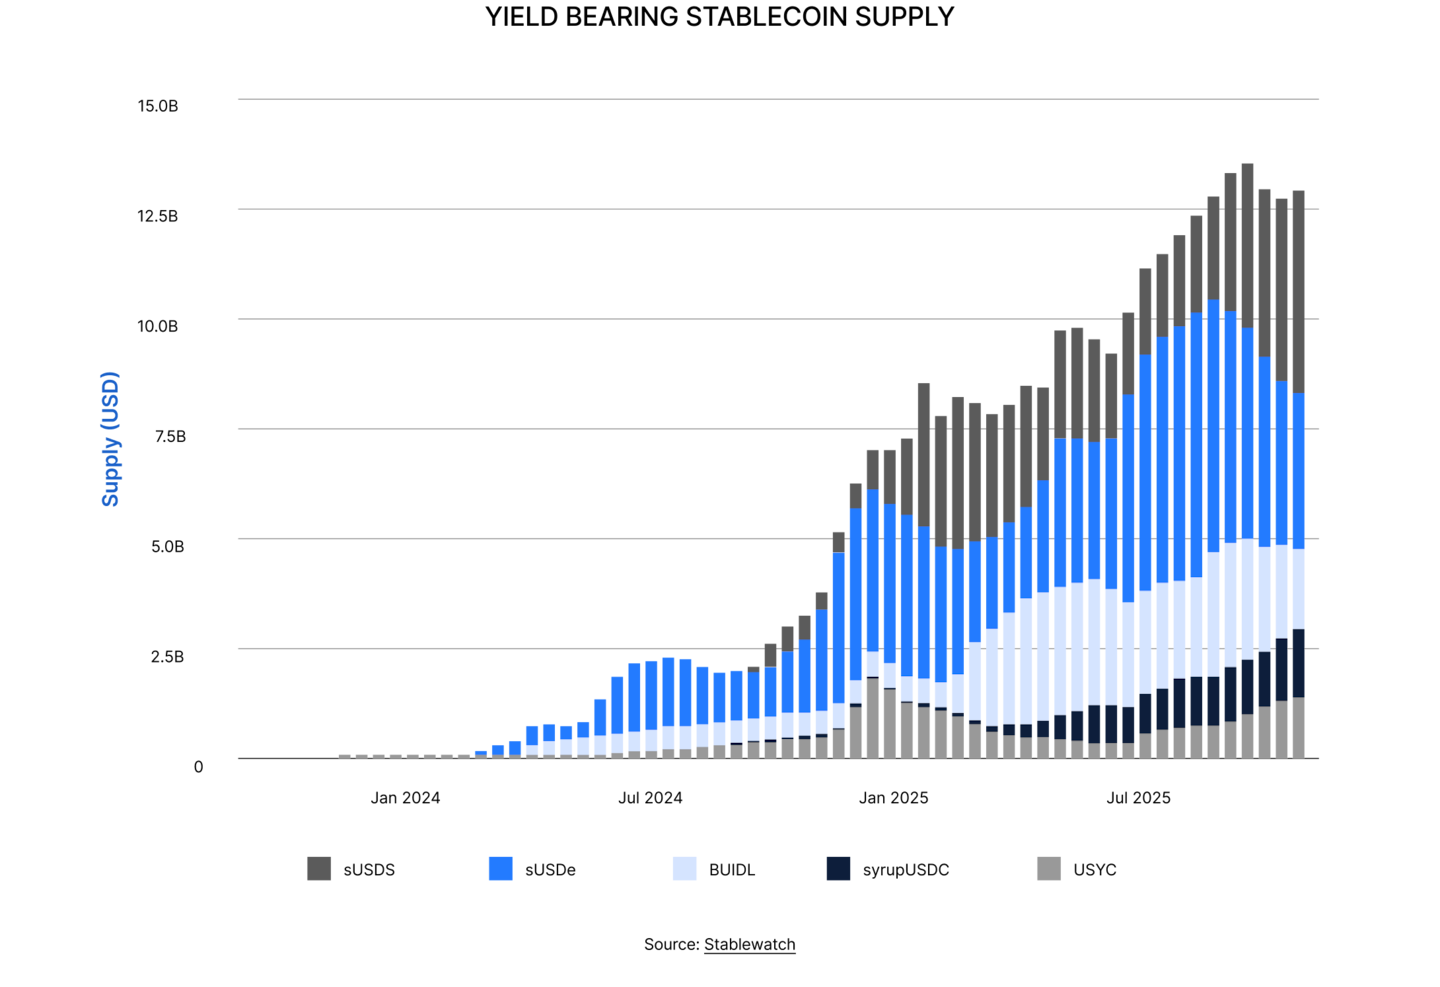
Yield Bearing Stablecoins, a Fast Growing Market
Yield-bearing stablecoins have also expanded rapidly, growing from $9.5 billion at the start of 2025 to more than $20 billion today. Instruments such as sUSDe, BUIDL and sUSDS attracted most of the inflows, while more than fifty additional assets now populate the broader category. Yields can range from 2% to 10%, with an average around 5%, placing them slightly above traditional money-market rates. These instruments blur the line between cash, deposits, DeFi yield strategies and tokenised treasuries, transforming stablecoins from passive wrappers into income-generating assets.
These patterns reinforce one another. Payments and remittances drive global distribution and high-frequency activity. Fiat-backed models provide the safety and credibility required for institutional adoption. Yield-bearing designs offer predictable yields and deepen liquidity onchain. Together, they form a usage landscape that is broader and more durable than any single narrative. Stablecoins are no longer tied to a single function, they have become the primary medium for value transfer, liquidity management and risk-controlled yield across the digital economy.
Stablecoins Enter the Mainstream Financial Layer
If 2025 was the year stablecoins regained scale and credibility, 2026 is set to mark their entry into mainstream finance. The combination of regulatory clarity, maturing infrastructure and diversified usage now provides a clear path toward broader integration across consumer finance, corporate operations and global payments.
Regulation remains the primary catalyst for 2026. The implementation of the GENIUS Act and MiCA brings standardised rules for issuance, reserve requirements and supervision, creating the first coordinated global framework for stablecoins. More jurisdictions are expected to follow, with active discussions in Asia around yuan-backed models and other regional currencies. This regulatory alignment should accelerate the arrival of non-USD stablecoins and open the door for a new wave of institutional issuers entering digital assets at scale.
Yield-bearing stablecoins are the segment to watch in 2026. Their value proposition is simple: stability, predictability and yield in a single product. With supply having doubled over the past year, they are positioned to become a core collateral type in DeFi and an emerging cash alternative for DAOs, corporates and investment platforms. As global interest-rate dynamics shift, competition between issuers and protocols around yield-bearing structures is likely to intensify.
Payments and settlements are also poised to accelerate. Stablecoin payrolls, contractor compensation and SME cross-border transfers are becoming more common as companies seek faster, cheaper alternatives to banking rails. B2B settlements between exchanges, liquidity providers and fintech platforms are increasingly moving onchain, with early signs extending to trade finance, ecommerce payouts and treasury operations. The rise of virtual cards and credit products backed by stablecoin balances strengthens the bridge between onchain money and everyday financial activity.
Still, key risks remain. A sustained decline in US interest rates would compress reserve income and reduce the attractiveness of fully backed and yield-bearing models alike, forcing issuers to compete more aggressively on efficiency, scale and distribution rather than on yield alone. At the same time, regulatory fragmentation across jurisdictions, uneven access to banking rails and concentration risk among custodians and issuers remain structural constraints.
Taken together, the trajectory is clear. Stablecoins are evolving from a crypto-native asset into a universal liquidity and settlement layer that connects consumer finance, institutional infrastructure and global payments.
Capital And Revenue Map: Who Earned, Who Faded
2025 marked a decisive shift in how value is generated and captured across the crypto economy. Revenue expanded across nearly all major sectors, but the distribution of that growth revealed a clear structural pattern: a small group of protocols continues to dominate fee capture while a new wave of entrants reshapes competition within key verticals.
At the same time, falling infrastructure costs allowed applications to scale far beyond previous cycles, reinforcing the shift from base-layer value capture to application-layer economics. The result is a DeFi landscape where revenue is rising, concentration remains high, and competitive dynamics are accelerating.
Where the Money Was Made: Sectors and Protocol Concentration
A DeFi Landscape Still Concentrated
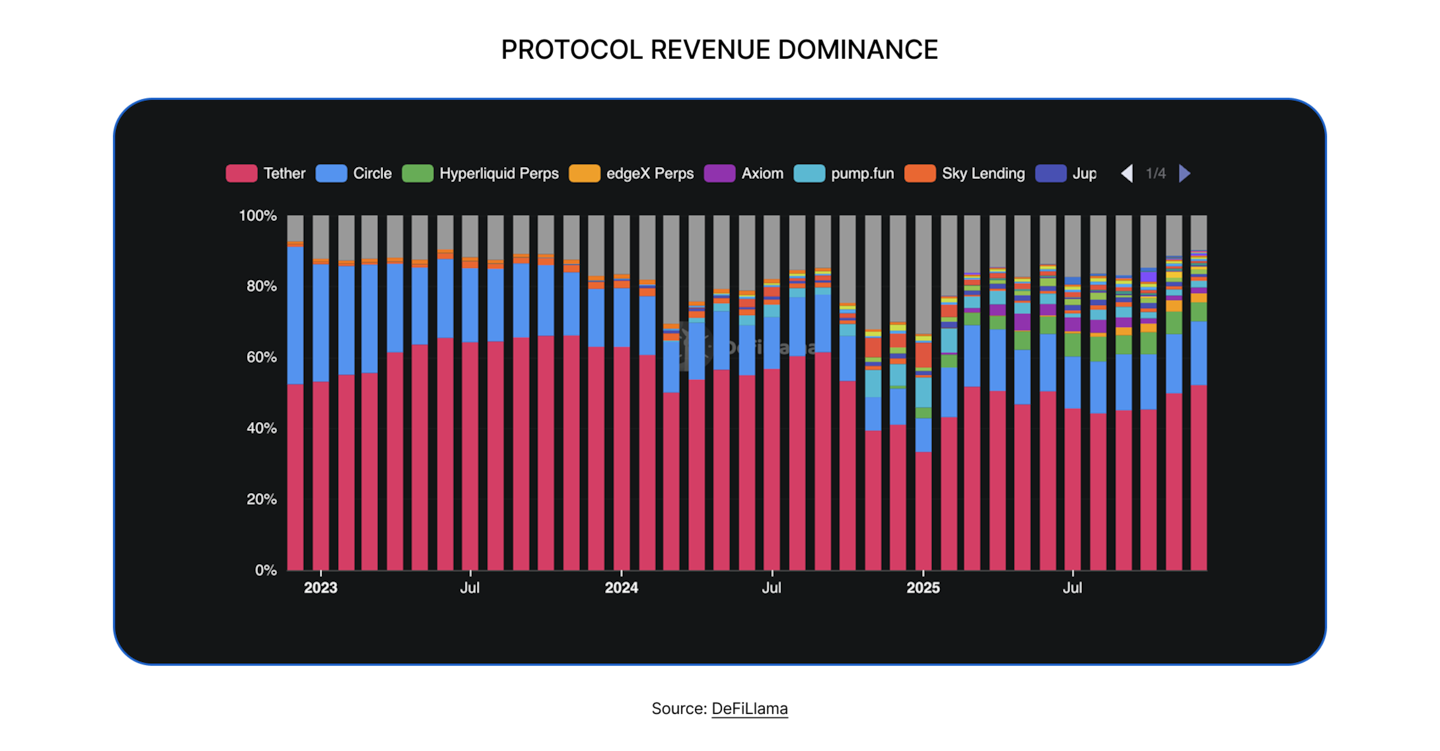
Despite the growth and diversification of activity in 2025, value capture within DeFi remained heavily concentrated. Across the year, the top ten protocols generated around 60% of all fees, while the top twenty consistently captured close to 80%. This pattern shows that users continue to gravitate toward a narrow cluster of platforms offering reliable execution, deep liquidity and proven operational performance.
One category sits far above the rest: stablecoin issuers. The dominance of Tether and Circle reinforces the conclusion drawn in the stablecoin section: digital dollars have become a foundational financial layer.
Below them, leading platforms such as Pump.fun, Uniswap, Lido, Aave, Sky and Hyperliquid show the same clustering effect. Activity does not spread evenly across the ecosystem but remains concentrated around a limited number of robust, established players operating across very different verticals. Yet the picture is more diversified than in early 2024, when Tether, Circle, Uniswap, Lido, Aave and Jupiter alone accounted for approximately 70% of total revenue. The emergence of new entrants signals a gradual broadening of competitive dynamics.
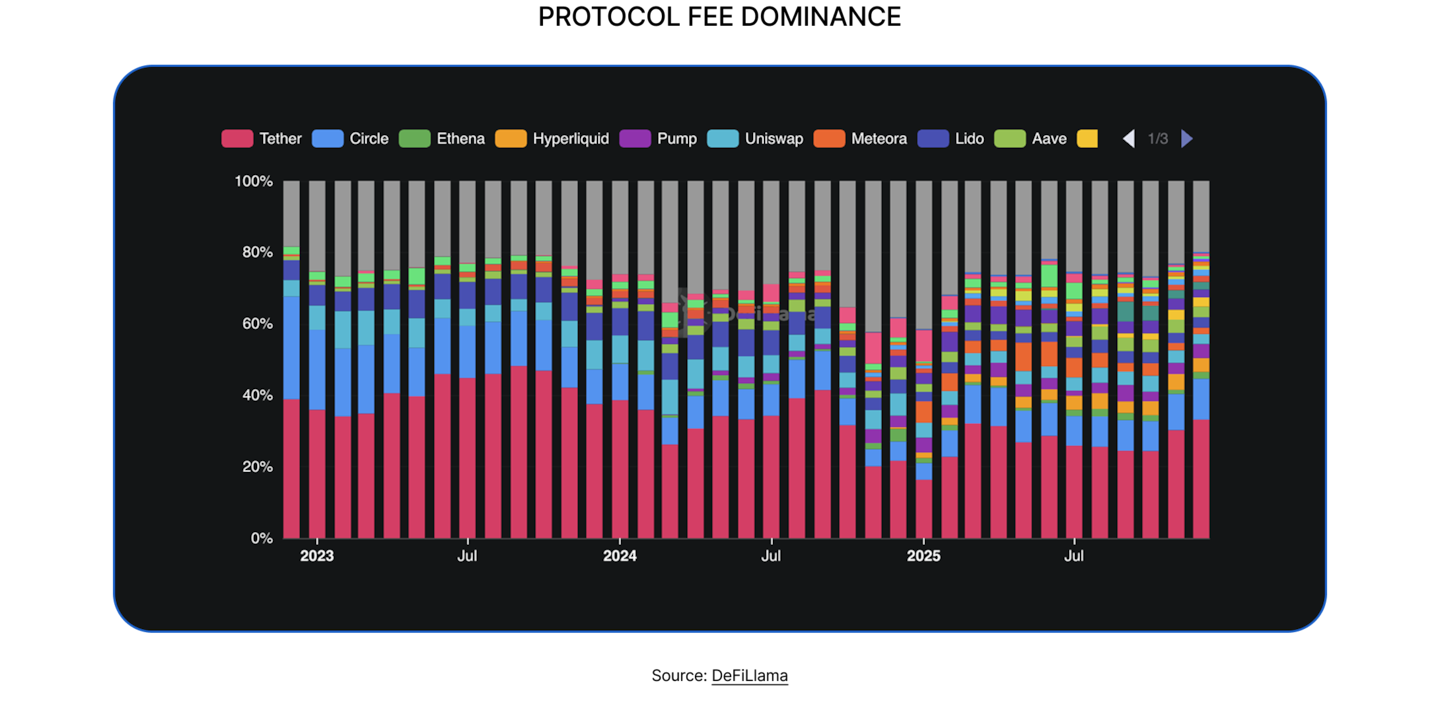
The revenue distribution makes this even clearer. Tether alone captured around 54% of all revenue, enabled by a reserve-based model where income scales with assets and marginal costs remain low. Circle followed with roughly 18%, reflecting a similar structure. Together, the two issuers represent nearly 75% of the revenue generated across DeFi, leaving the remaining 25% to be shared among a wide range of protocols.
Within that remaining share, perpetual exchanges stood out. Hyperliquid, EdgeX, Lighter and Axiom together generated around 7.5% of industry revenue, suggesting that perps may be capable of rivalling the revenue generated by stablecoin issuers.
Sector and Protocol Level
The charts below serve as the reference point for this analysis as they map revenue across the main DeFi verticals.
Perpetual Exchanges: The Dominant Engine
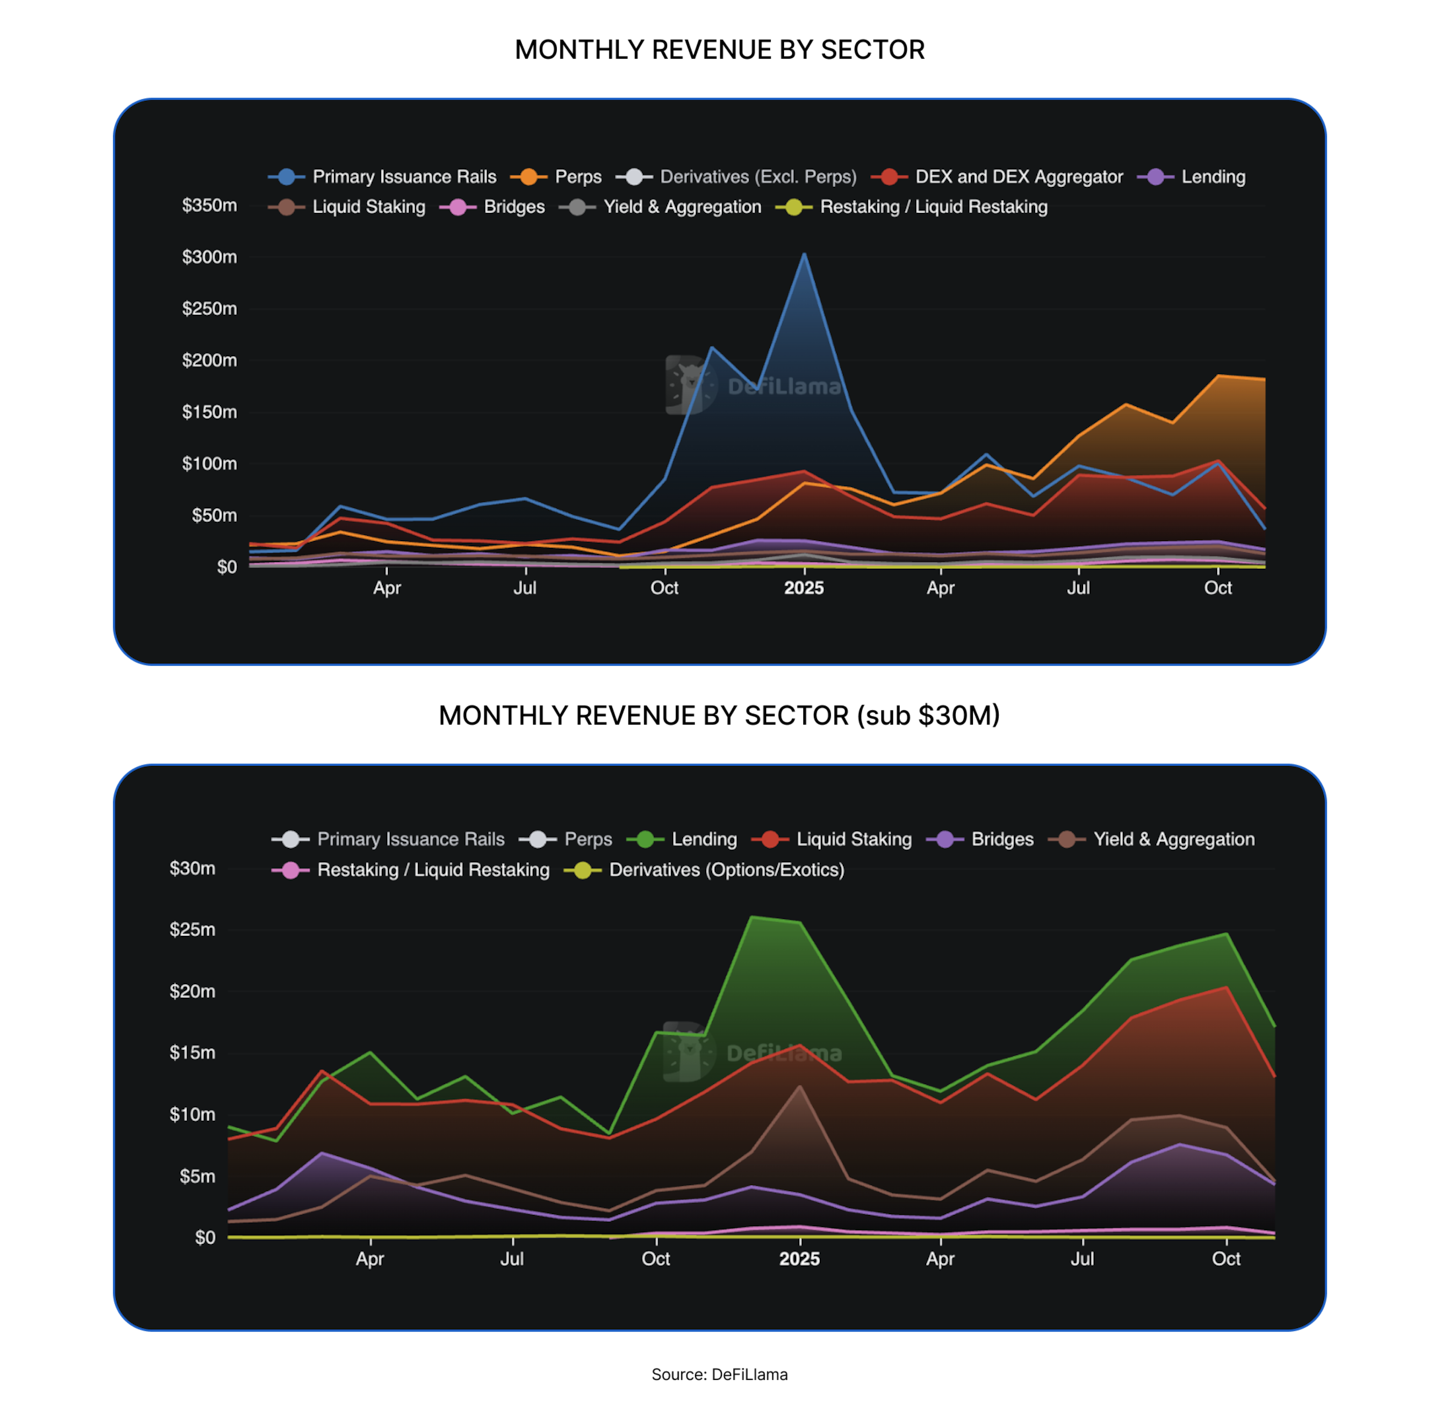
Perpetuals were one of the strongest revenue engines of the year. Monthly sector revenue doubled from roughly $100 million to more than $200 million, driven by renewed trading activity and major improvements in execution environments. After years of lagging behind centralised exchanges due to high fees, latency and uneven UX, onchain perps finally reached full competitiveness in 2025. Notably, perps revenue has become largely uncorrelated with market direction, confirming that onchain derivatives have matured from a cyclical product into a structural financial primitive.
Hyperliquid led this shift, rapidly absorbing the market share previously held by Jupiter Perps and establishing itself as the sector’s anchor. New entrants such as Aster, EdgeX and Lighter intensified competition and pushed execution quality higher. Within a single year, the market became highly consolidated, with roughly five protocols capturing nearly 90% of fees. This competition is ultimately beneficial: it drives fees down, improves execution and accelerates the migration of perps from centralised exchanges to onchain venues.
Primary Issuance Rails: A New Category Takes Shape
Primary issuance rails emerged as one of the major winners of 2025. The momentum began in 2024 with Pump.fun, which gamified token creation and tapped deeply into retail participation. The sector peaked in late 2024, coinciding with the U.S. elections and the launch of the TRUMP token, a moment that fuelled a surge in speculative activity. From that point onward, issuance rails consistently generated around $100 million in monthly revenue throughout 2025.
Pump’s dominance began to soften as new platforms entered the market, including Four.Meme, Binance Alpha and LetsBonk.fun. Although the category remains heavily led by Pump, the arrival of competitors has pushed the sector toward a more competitive structure.
The key takeaway is that issuance rails represent a new business model, one that monetises attention, distribution and entertainment, rather than traditional liquidity or trading activity.
DEXs and Aggregators: Strong Growth but Market-Linked
DEXs and aggregators also recorded meaningful revenue growth. After generating around $25 million per month in 2024, the sector approached the $100 million range in 2025. Unlike perps, however, DEX activity remains closely tied to market conditions. Revenue fluctuates with trader sentiment, expanding during periods of volatility or risk-on behaviour and contracting when activity slows.
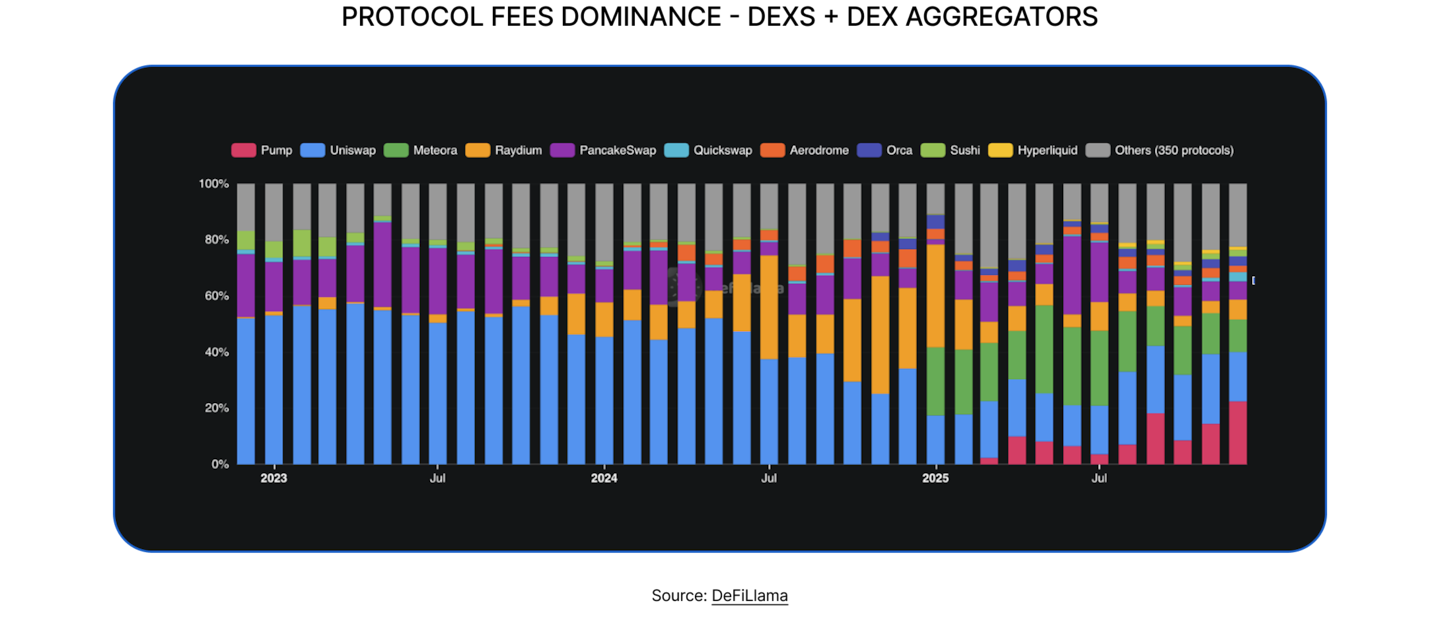
What stands out in 2025 is the sharp rise in competition. A market once dominated by two or three platforms capturing nearly 80% of fees is now far more balanced: today, ten protocols collectively account for that same 80%. Uniswap’s decline illustrates this shift clearly, with its dominance falling from roughly 50% to around 18% in a year. PancakeSwap and Raydium experienced similar contractions, each losing roughly half of their market share over the past few years.
The driver behind this redistribution is the emergence of more innovative, efficient and often cheaper alternatives. Platforms such as Meteora, PumpSwap, Aerodrome and Hyperliquid Spot have reshaped routing dynamics and fee structures, forcing incumbents to compete on execution quality, cost efficiency and overall user experience.
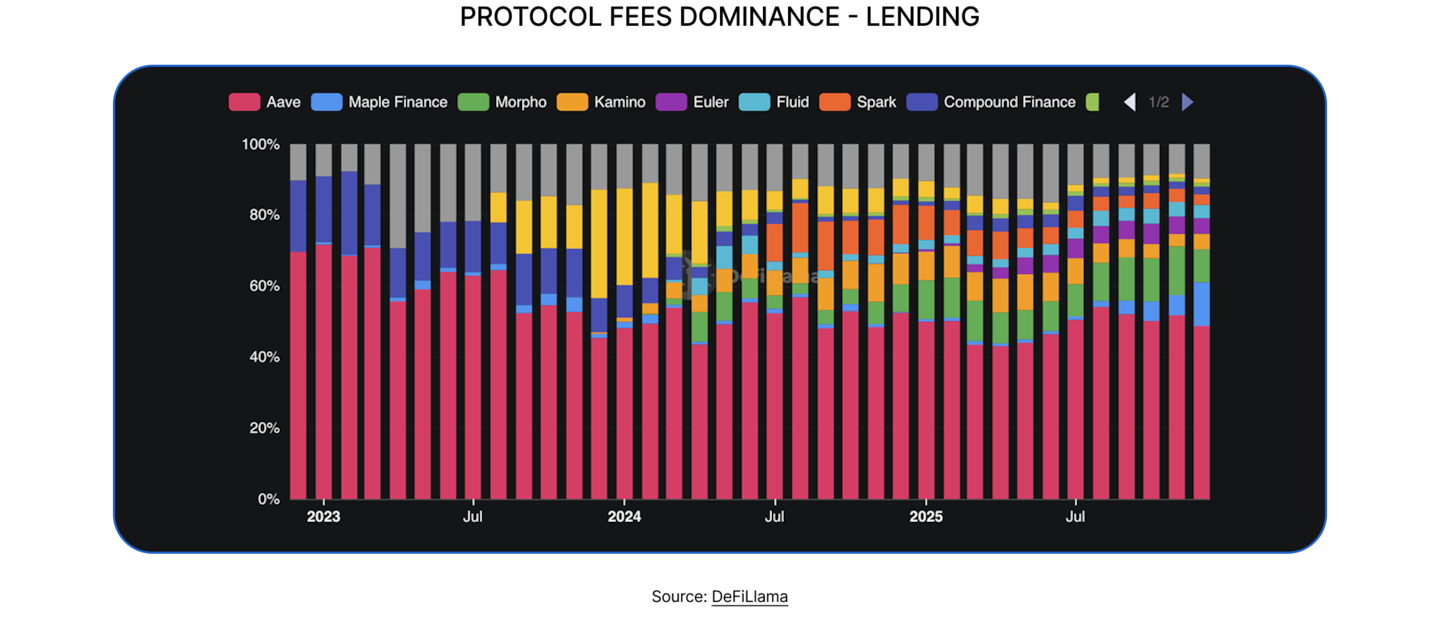
Lending, Curation As The Engine of Growth
Lending revenue increased from around $10 million per month in 2024 to between $15-25 million per month in 2025, although volumes continued to fluctuate with market sentiment. The sector’s overall size did not transform dramatically, but its internal structure shifted.
Aave remained the anchor, capturing close to half of all fees and strengthening its position through a clearer institutional and RWA-focused roadmap.
At the same time, growth increasingly came from curated credit markets. Morpho, Maple Finance and Euler expanded by offering controlled, risk-segmented lending environments aimed at institutions seeking predictable exposure. This marks a gradual divergence within the sector: open, retail-oriented platforms like Kamino or SparkLend play a smaller role in fee generation, while regulated, curated liquidity channels steadily gain relevance.
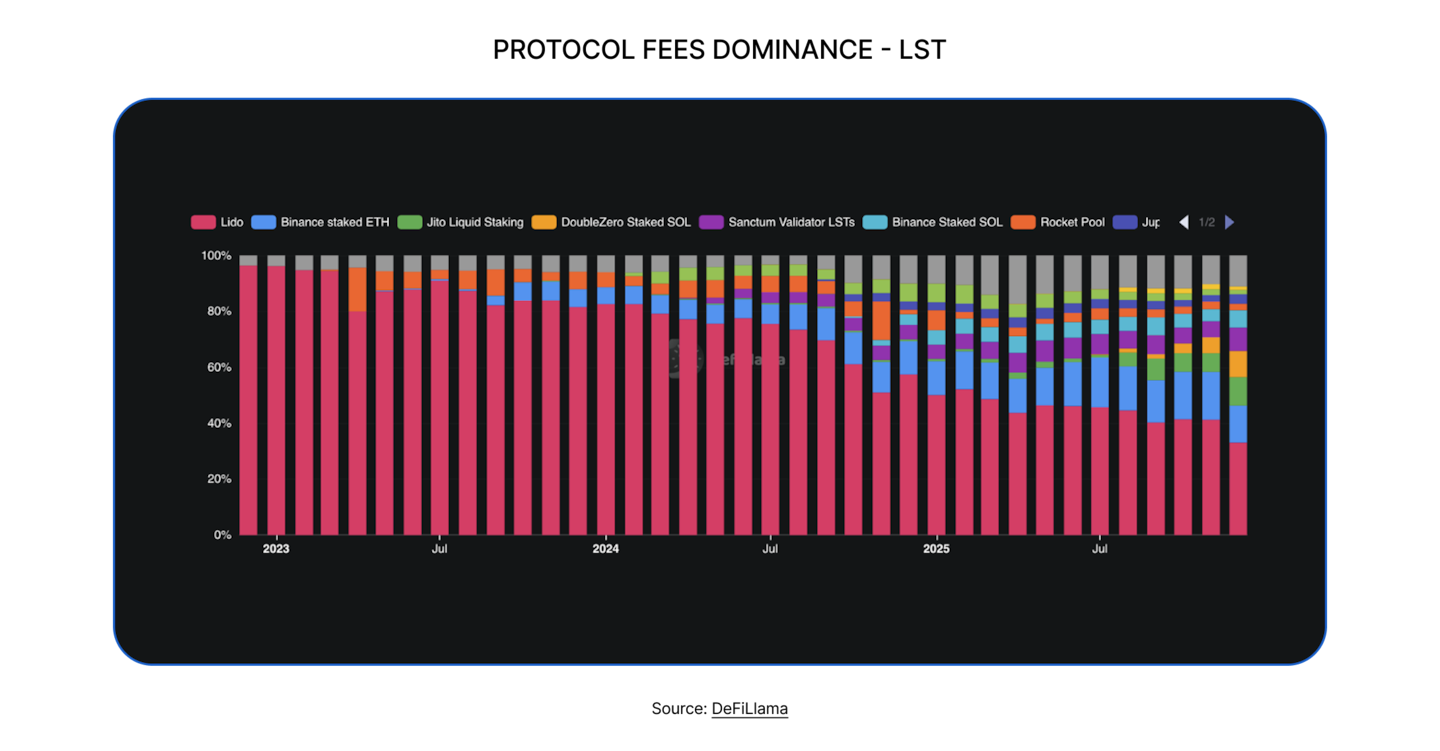
Liquid Staking, CEXs competing with Lido
Liquid staking recorded steadier progress, with monthly revenue rising from around $10 million to roughly $15 million. This growth was primarily structural, supported by declining global interest rates that pushed market participants to seek yield alternatives, as well as increasing regulatory acceptance of staking, which encouraged institutional participation.
At the protocol level, the competitive landscape shifted meaningfully. Lido, which captured nearly 80% of market share in 2024, saw its dominance erode as new LST ecosystems expanded, particularly on Solana, and as major competitors such as Binance Staked ETH, Staked SOL, Jito and Sanctum strengthened their positions. The result is a market that is becoming increasingly competitive, a dynamic that ultimately benefits stakers through greater choice, improved services and broader diversification.
Contrasting Results Across Other Sectors
Zooming into three sectors generating less than $50 million per month, most categories saw year-on-year growth, although with different levels of consistency:
- Yield markets, primarily led by Pendle, grew but remained volatile. Inflows accelerated during liquidity-rich and incentive-heavy periods but contracted quickly during risk-off phases, reflecting the segment’s sensitivity to broader macro and crypto market conditions.
- Bridges maintained stable revenue between $3-5 million per month. Despite healthy usage, fierce fee competition pushed operators to constantly lower pricing, limiting revenue expansion even as volumes remained strong.
- Restaking, liquid restaking and derivatives (excl. perps) continued to lag. Fee generation remained flat, signalling limited adoption and a lack of established product-market fit. These sectors may require further innovation before gaining meaningful traction.
RWA and Stablecoin Issuers, Opaque Fee Capture
RWA platforms and stablecoin issuers were two of the most important themes of 2025, yet both remain difficult to analyse through a pure onchain lens. Much of their fee generation occurs offchain or within centralised structures, making transparent revenue assessment challenging.
For stablecoins, the example of Tether and Circle shows how lucrative the model can be. Reserve-based income scales with supply, and favourable regulatory developments suggest that both revenue and the number of compliant issuers will continue to grow. As new entrants arrive under clearer regulatory frameworks, the market is likely to become more balanced, reducing the extreme concentration seen today.
As for RWA, TVL increased significantly throughout the year, but actual fee capture remains difficult to quantify. Most issuers operate as traditional financial entities, where management fees, treasury yield spreads and servicing costs are not disclosed onchain.
Infrastructure Costs Collapsing, DeFi Thriving
A clear shift took place in 2025: DeFi applications began generating more fees than the underlying blockchains they operate on. This marks a decisive moment in the maturation of the industry. Infrastructure has become cheaper, faster and more efficient, creating conditions where applications, not base layers, capture most of the economic activity.
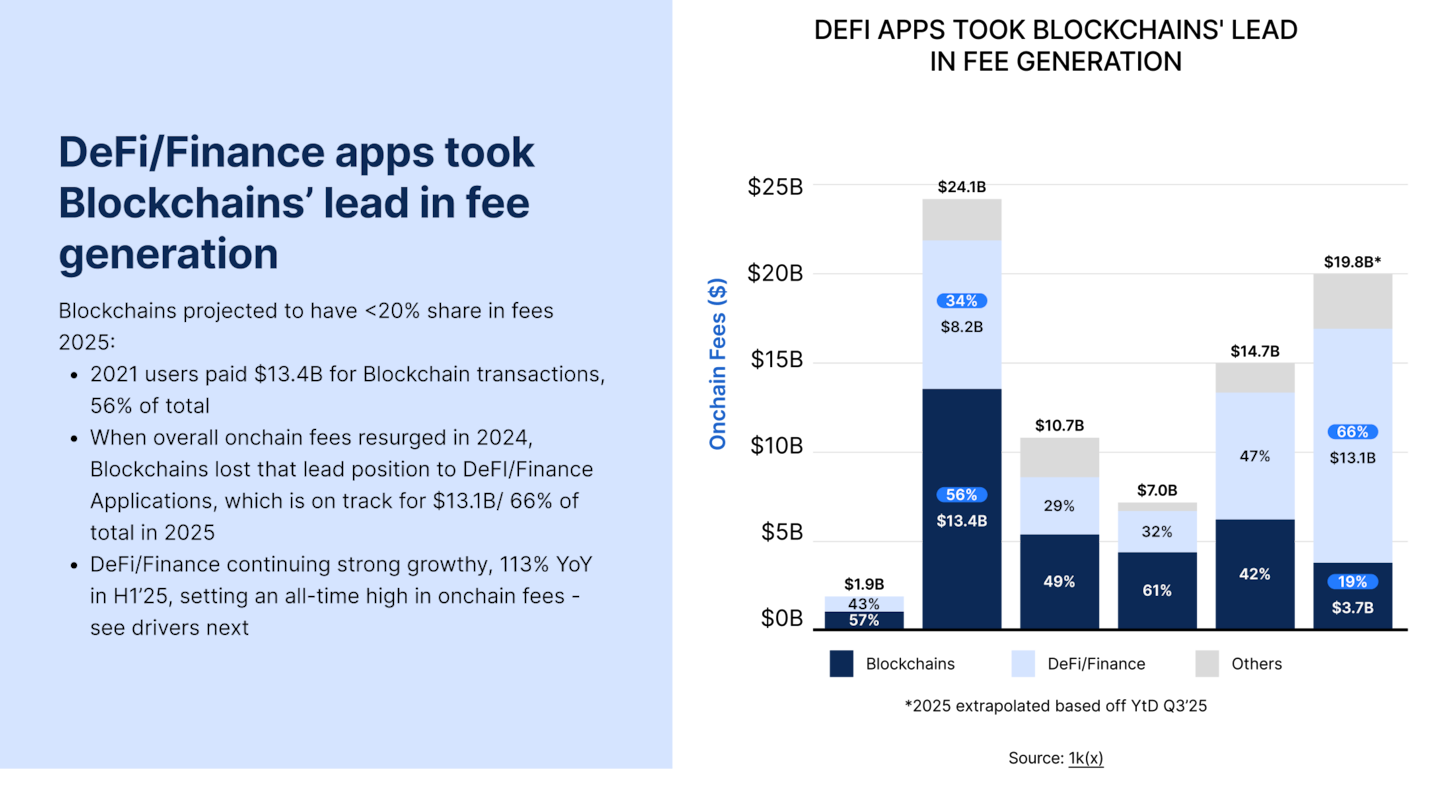
Competition has played a central role in driving costs down. Solana’s rise in 2021 set a clear precedent by demonstrating that high throughput and low fees were achievable, pushing Ethereum and other ecosystems to accelerate their scaling roadmaps. The same dynamic still exists across all major chains: execution is increasingly commoditised, and networks compete to deliver the cheapest and most reliable blockspace. The result is an environment where blockspace is no longer scarce, allowing applications to operate profitably at scale for the first time.
Ethereum illustrates this evolution perfectly. Two major upgrades, Dencun and Pectra, sharply reduced fees while increasing usable throughput. Transacting on Ethereum now costs less than $1 even as daily activity exceeds levels seen during the 2021 bull market. A report by 01kX, using DeFiLlama, Dune and TokenTerminal data, estimates that the average transaction cost has fallen by 86% while the number of transactions has grown by 2.7 times compared with the peak of 2021.

This mirrors the trajectory of early internet infrastructure: as connectivity became cheaper, entire categories of applications,websites, ecommerce, digital services, emerged on top of it. DeFi is now following the same pattern.
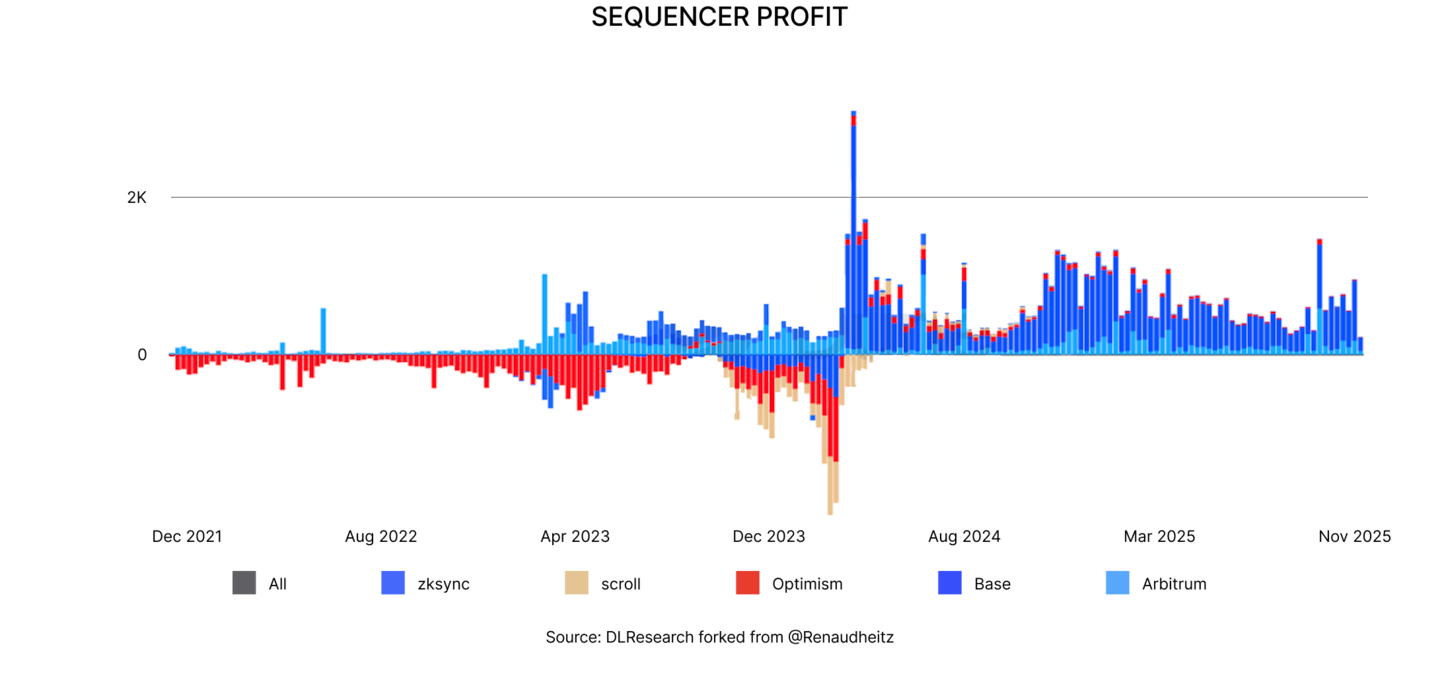
Consequence #1 : Layer 2 Networks Become Cash-Flow Positive
As infrastructure costs decline, the benefits are most visible on Layer 2s. Dencun’s introduction of cheaper blobspace in March 2024 dramatically lowered settlement costs for Layer 2s and moved many of them into positive revenue territory. Optimism and Base both shifted from structural losses to sustained profitability.
With lower operating expenses and rising activity on the application layer, Layer 2s now have both the margin and the incentive to reinvest aggressively into growth.
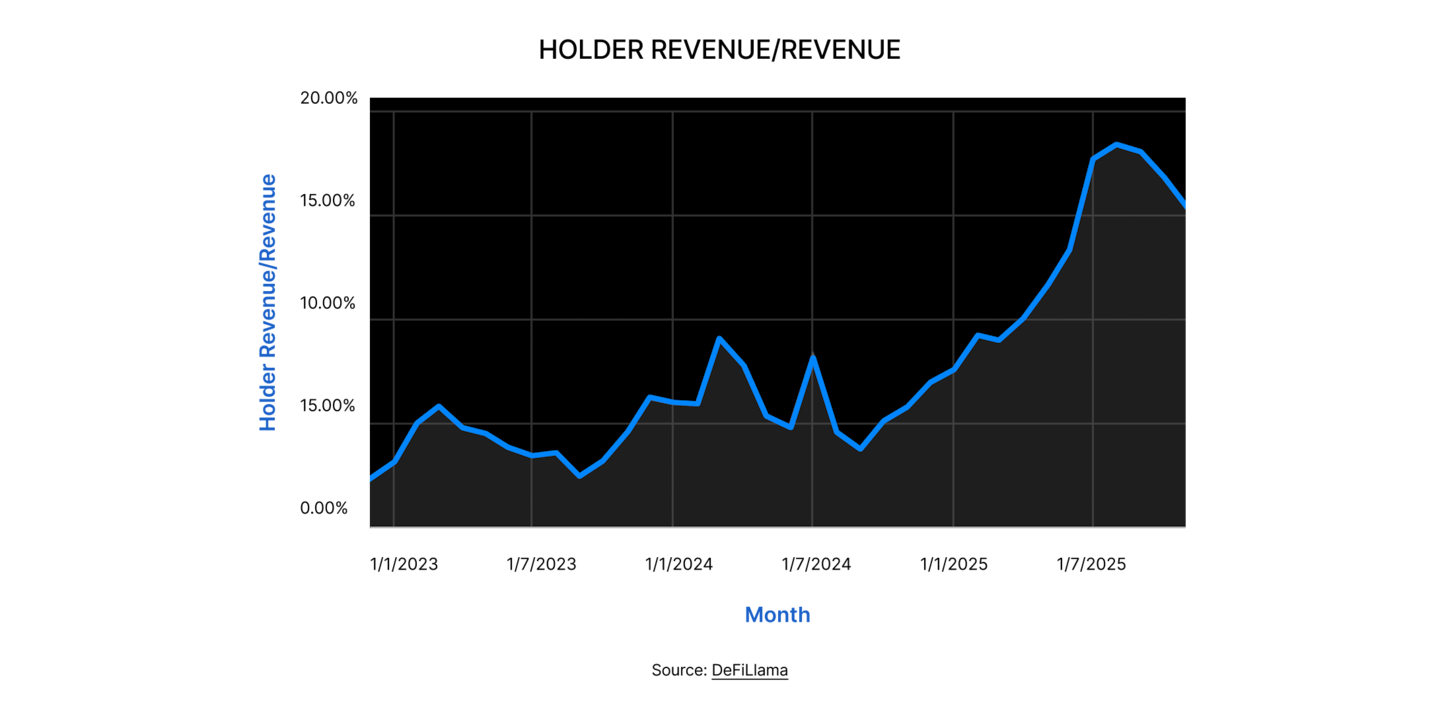
Consequence #2: Protocol Value Is Increasingly Returned to Holders
A growing share of industry revenue is now flowing back to tokenholders. As protocols become more profitable, sustainable and less dependent on inflationary rewards, value distribution has become a core feature of the market. The shift in regulatory tone, from hostile to constructive, has reinforced this trend, giving teams clearer frameworks for revenue sharing, treasury yield distribution or buyback-and-burn strategies.
While only around 5% of protocol revenue was redistributed to holders before 2025, this number has tripled to roughly 15%. Major protocols such as Aave and Uniswap, which historically avoided explicit value distribution, are now moving in this direction.
As competition intensifies and tokens increasingly resemble traditional financial assets, more protocols are expected to adopt similar approaches.
Consequence #3: Emergence of New Business Models
The reduction in infrastructure costs did far more than improve efficiency, it opened the door to entirely new business models. When blockspace becomes cheap, protocols can experiment freely with how they launch, monetise and distribute products.
Token issuance is the clearest example. What was expensive and limiting in 2021, such as minting an NFT or issuing a token, is now trivial. In a few clicks, anyone can launch a token on platforms like Pump, which has effectively democratised the launchpad. Monetisation no longer comes from the token itself but from attention and distribution.
The same dynamic applies to trading. Perps and DEXs now operate in an environment where onchain execution is fast, cheap and reliable enough to compete with CEXs. Fee capture in these markets now reflects execution quality rather than network limitations, making the model sustainably profitable for the first time.
A performance-fee model is also emerging as a viable path to profitability, mirroring traditional finance. Lido demonstrated this early by charging a fee on staking rewards, but for smaller protocols high infrastructure costs once made this approach difficult to sustain. With today’s efficiency, any protocol that generates yield, from stablecoins to RWAs to Pendle-style products, can capture a small fraction of that yield and operate profitably.
In short, cheaper blockspace removed friction. It unlocked experimentation not only technically but economically, allowing protocols to explore new models and reach product-market fit with far more freedom than in previous cycles.
Consequence #4: Competition Compresses Prices and Improves User Experience
As the charts in the previous sections showed, competition has intensified across every major DeFi vertical. Falling infrastructure costs and a wave of new entrants in 2025 reshaped markets such as perps, DEXs, liquid staking and issuance rails. Sectors once dominated by two or three protocols now display a broader and healthier distribution of activity.
This competitive pressure forces protocols to optimise execution, reduce fees, improve routing and expand features. Perps demonstrated this most clearly: a single year of new entrants compressed fees, raised execution quality and redistributed market share. The same dynamic is now unfolding across DEXs, lending and staking.
The result is a steadily improving user experience where competition has become a structural driver of progress, ensuring that efficiency and user alignment continue to accelerate as the ecosystem matures.
Closing Thoughts and Outlook
At the end of 2025, the structure of the industry looks very different from the cycle that preceded it. Infrastructure has become cheaper, more efficient and more secure, creating an environment where applications can scale without being constrained by execution costs. This shift has allowed DeFi to capture a growing share of the value generated onchain. With regulatory clarity improving across major jurisdictions, the conditions for sustainable growth are clearer than at any point since the sector emerged.
Yet not all verticals have found their footing. Segments such as restaking, liquid staking, options and exotic derivatives remain in an exploratory phase. Their long-term relevance depends largely on whether they can demonstrate real demand beyond incentives.
Competition and product sophistication are rising across the leading sectors, from perps to DEXs and lending. Perps provided the clearest preview in 2025: a wave of new entrants reshaped a previously concentrated market, pushing incumbents to innovate, sharpen execution and compress fees. The same dynamic is emerging across other verticals, where protocols are increasingly forced toward greater efficiency and more user-aligned models.
As costs continue to fall and innovation spreads, end users will benefit the most through better pricing, improved execution and higher reliability.
Trading Stack: Perps, Spot, And Primary Issuance Rails

As spot DEXs, perps DEXs, and issuance platforms converge into one trading stack, how do you expect the role of oracles in execution quality and risk management to change over the next cycle?
While platforms will increasingly verticalize their offerings through either prime brokerage-style unified UX or full vertical integration like Euler or Fluid on EVM networks, the underlying technical stack will remain specialized. We’re seeing more acquisitions and consolidations, but the teams building each component continue to operate as specialized units focused on their domain. Oracle infrastructure follows this same pattern: the end-user experience becomes seamless and abstracted away, but the role of dedicated data providers in execution quality, risk management, and security remains critical. As an analogy, you can add as many electronic gadgets and additional features to a car to make it more useful - but if the engine (the oracle) malfunctions, the whole system can get a hit or crash fully.
Most DeFi users won’t directly interact with or even notice oracle infrastructure, yet specialized teams will continue innovating on these complex, multi-layered systems. The convergence is happening at the product and brand level, not at the technological expertise side. One can observe that with specific oracle offerings, i.e., in the case of RedStone oracles offering Low-latency (Bolt), Efficiency (Atom), Risk (Credora) or RWA feeds.
How do you think oracle infrastructure should adapt to a world where much of the order flow is driven by intents, RFQ systems, and routing algorithms rather than direct user swaps?
At its core, an oracle aggregates different inputs from data providers, i.e. Market Makers, or direct sources, i.e. a DEX or aggregator, and calculates the most objective price as a function of those inputs. RedStone’s modular approach has proven our technology can ingest data in various formats from different providers, making it adaptable to evolving market structures. The design choices we made in 2022 allow us to adapt to the ever-evolving data sourcing vertical.
Whether prices come from traditional order books, RFQ systems, intent-based protocols, off-chain TrafFi systems, or proprietary routing algorithms, they ultimately represent yet another input format for price discovery. If there’s demand for incorporating these new trading schemas into oracle feeds, we’re positioned to develop the necessary infrastructure to capture that volume and maintain the most secure and specialised onchain price feeds available.
What are the most important oracle design trade offs that high throughput perps venues and order book DEXs are wrestling with today, and how do you see those trade offs evolving as latency and volume increase?
High-throughput oracles present unique design trade-offs that RedStone has been addressing extensively with RedStone Bolt, which delivers onchain oracle data in a Push model with previously unprecedented sub-20 millisecond latency for chains like MegaETH and Monad. The fundamental challenge starts with a chicken-and-egg problem: building technology capable of sub-20ms delivery is meaningless without actual demand from decentralized applications. Traditional blockchain network constraints made this level of granularity impossible, but new high-performance chains are finally creating the infrastructure where demand can materialize, enabling builders to experiment with what’s possible in such a high-velocity data environment. Euphoria, powered by Bolt, can be a good example.
A critical design choice involves the aggregation algorithm used to produce the final onchain price from multiple data inputs. With real-time delivery, every incremental trade on underlying exchanges affects sequential prices significantly, making the choice between median, weighted median, or other mathematical functions far more consequential than in traditional oracle designs. Additionally, technical factors like geographical proximity to data sources become dramatically more important at this frequency level, as even minor latency differences compound when delivering prices dozens of times per second.
These high-frequency oracles represent one of the most technologically advanced oracle categories in blockchain infrastructure, requiring specialized expertise across aggregation mathematics, network architecture, and real-time data processing that most teams simply cannot replicate. Our team has always followed a builders, for builders motto, hence we enjoy such technical challenges.
As oracle extractable value becomes more visible, what is the right way for the ecosystem to handle it so that perps venues, money markets, and traders all see it as a feature rather than a hidden tax?
Oracle Extractable Value is an inherent part of DeFi infrastructure that can be managed effectively with adequate design. As the onchain market grows and DeFi volume scales, OEV solutions will play the key role to redistribute this value to the appropriate participants. RedStone Atom, developed in partnership with FastLane, represents a fundamental reimagining of how oracles handle OEV by capturing it through atomic liquidation auctions and routing it back to the protocols that generated it in the first place.
What makes Atom distinctive is that it doesn’t just redistribute value, it actively improves protocol performance. By introducing zero-latency oracle updates that trigger exactly when liquidations become possible, Atom allows lending protocols to offer higher LTV ratios and deliver better risk-adjusted returns than competitors using legacy push feeds. The atomic auction mechanism bundles price updates, liquidations, and OEV payouts into a single transaction under 300 milliseconds, eliminating front-running while capturing over 90% of liquidation value that would otherwise leak to MEV bots. Conservative estimates suggest legacy oracles have lost over $500 million to OEV.
Rather than viewing OEV as a hidden tax, Atom transforms it into a revenue stream that protocols can use to boost user yields, reduce borrow fees, or fund development, turning what was previously value extraction into a competitive advantage for protocols that adopt it.
In a future where perps, spot, and issuance all lean on the same data backbone, what kind of failures or feedback loops worry you most at the oracle layer, and how can the industry preempt them?
Derivative products typically leverage spot prices as their underlying reference, which creates natural spillover risks. A vulnerability in the spot token’s smart contract or an issue with exotic spot asset pricing could cascade into derivative markets built on top of that data. However, with rigorous due diligence when evaluating and constructing oracle price feeds, placing data intelligence at the front of the process, these risks become manageable. A good example of potential risks was visible on the 10th of October crash, where a flash depeg report by the internal CEX oracle of margin assets like USDe caused an even bigger liquidation cascade.
The key is maintaining that disciplined approach as the ecosystem scales. At RedStone, we haven’t experienced a single mispricing event, and our operational focus is on continuing that track record.
Perps venues increasingly list long tail assets and structured products; what kind of market structure or liquidity conditions do you believe should exist before an oracle feed for a new market considered safe?
There’s a strong need for quantified and objective oracle requirements when deciding to support new market feeds. At RedStone, we maintain clear thresholds based on liquidity metrics across both onchain venues and centralized exchanges that asset issuers must meet before we’ll consider developing a price feed. Having clear-cut rules around market depth, trading volume, and liquidity distribution is essential for determining when an asset has sufficient market structure to support a safe oracle feed. Our proprietary framework protects both the oracle infrastructure and the protocols relying on it from manipulation risks inherent in thin or fragmented markets.
A great example is markets powered by HyperStone, a bespoke Hyperliquid HIP-3 oracle. Our team, together with the deploying party, like Felix, carefully selects assets supported and helps to navigate new market parameters like max leverage or open interest. We see a great opportunity in commodities like Gold or stocks like TSLA.
Trading Stack: Perps, Spot, And Primary Issuance Rails
The structure of onchain markets changed fundamentally in 2025. What once existed as separate layers of activity, from swapping on AMMs to trading perpetuals or issuing tokens on new rails, has started to behave like a unified trading system.
Liquidity now moves more fluidly across issuance, spot markets, derivatives venues and speculative funnels, and user behaviour responds rapidly to catalysts that propagate across the entire stack. Behind this consolidation is a shift in architecture. Execution has become more abstract, collateral more mobile and information more immediately priced.
The result is a market in which DEXs, perps, issuance platforms and prediction markets no longer operate as isolated primitives but as linked components within a continuous trading environment.
DEXs: From AMMs to Intent-Based Execution
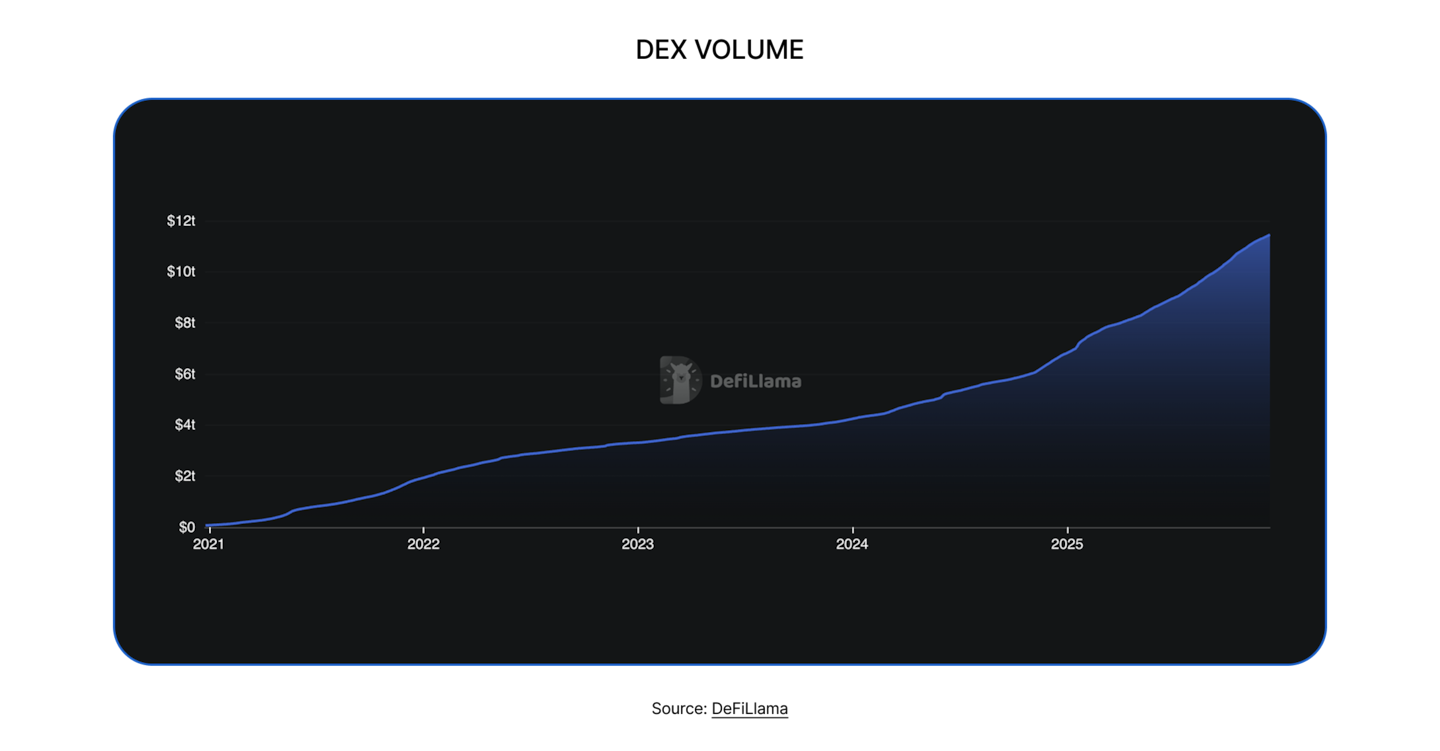
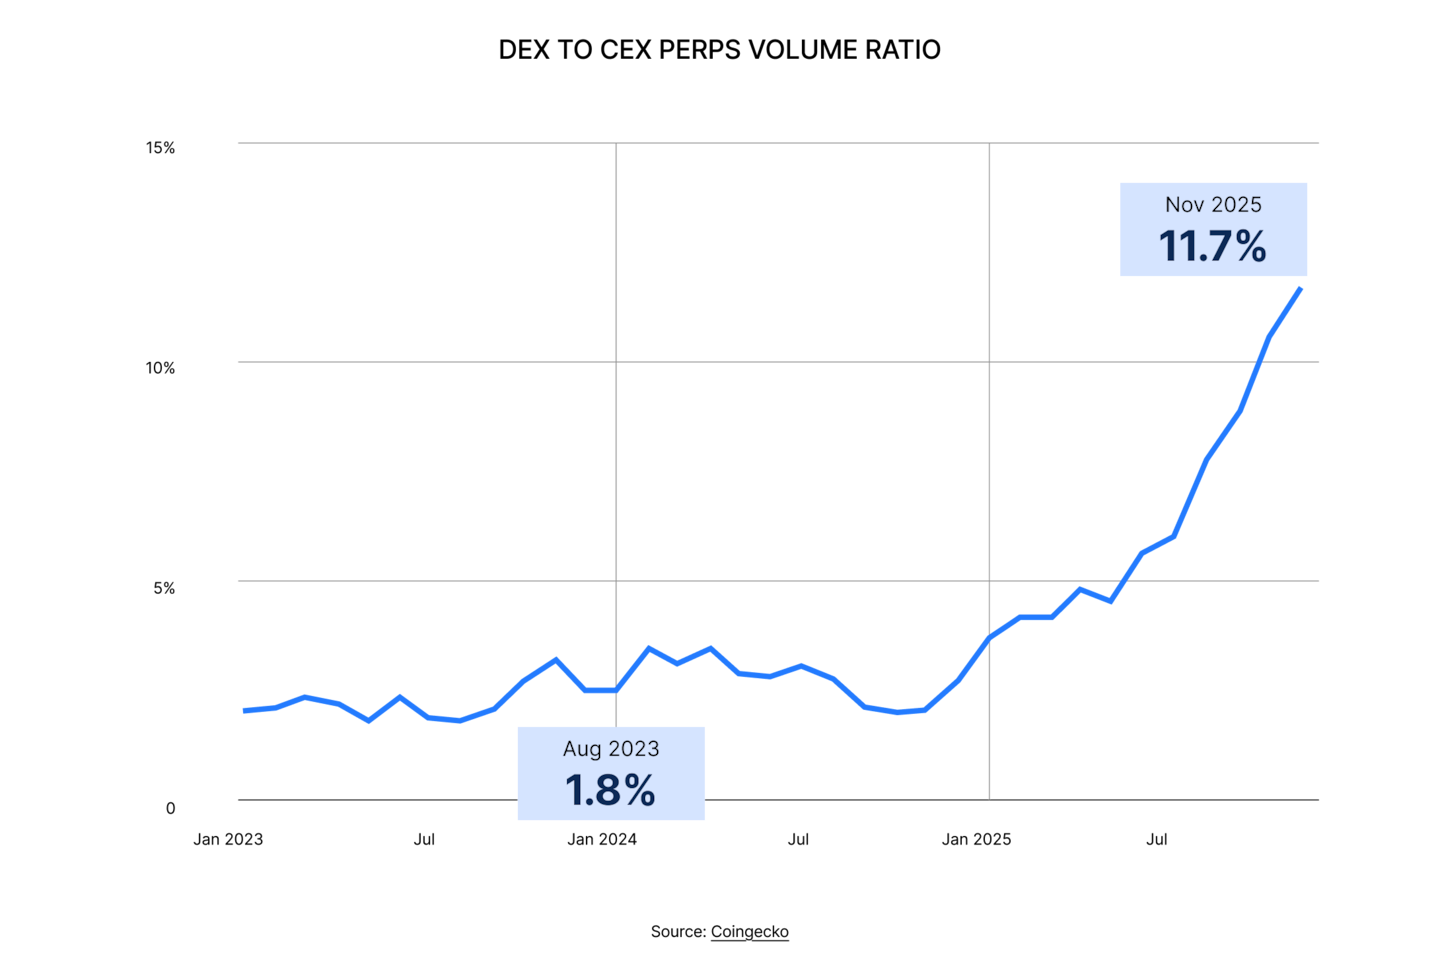
Decentralised exchange activity continued to expand materially in 2025. Cumulative DEX TVL rose from 4.2 trillion dollars at the start of 2024 to 6.8 trillion by year-end, before climbing further to 11.4 trillion in 2025. At the same time, DEXs increased their share of global spot trading, rising from roughly 4% to around 20% of combined CEX and DEX spot volume. This sustained uptrend confirms that onchain trading is not merely keeping pace with centralised venues, but steadily gaining market share. Yet behind this expansion lies a market undergoing a structural transformation. Rising competition, new execution models and the abstraction of user choice are reshaping how swaps happen and who captures the resulting value.


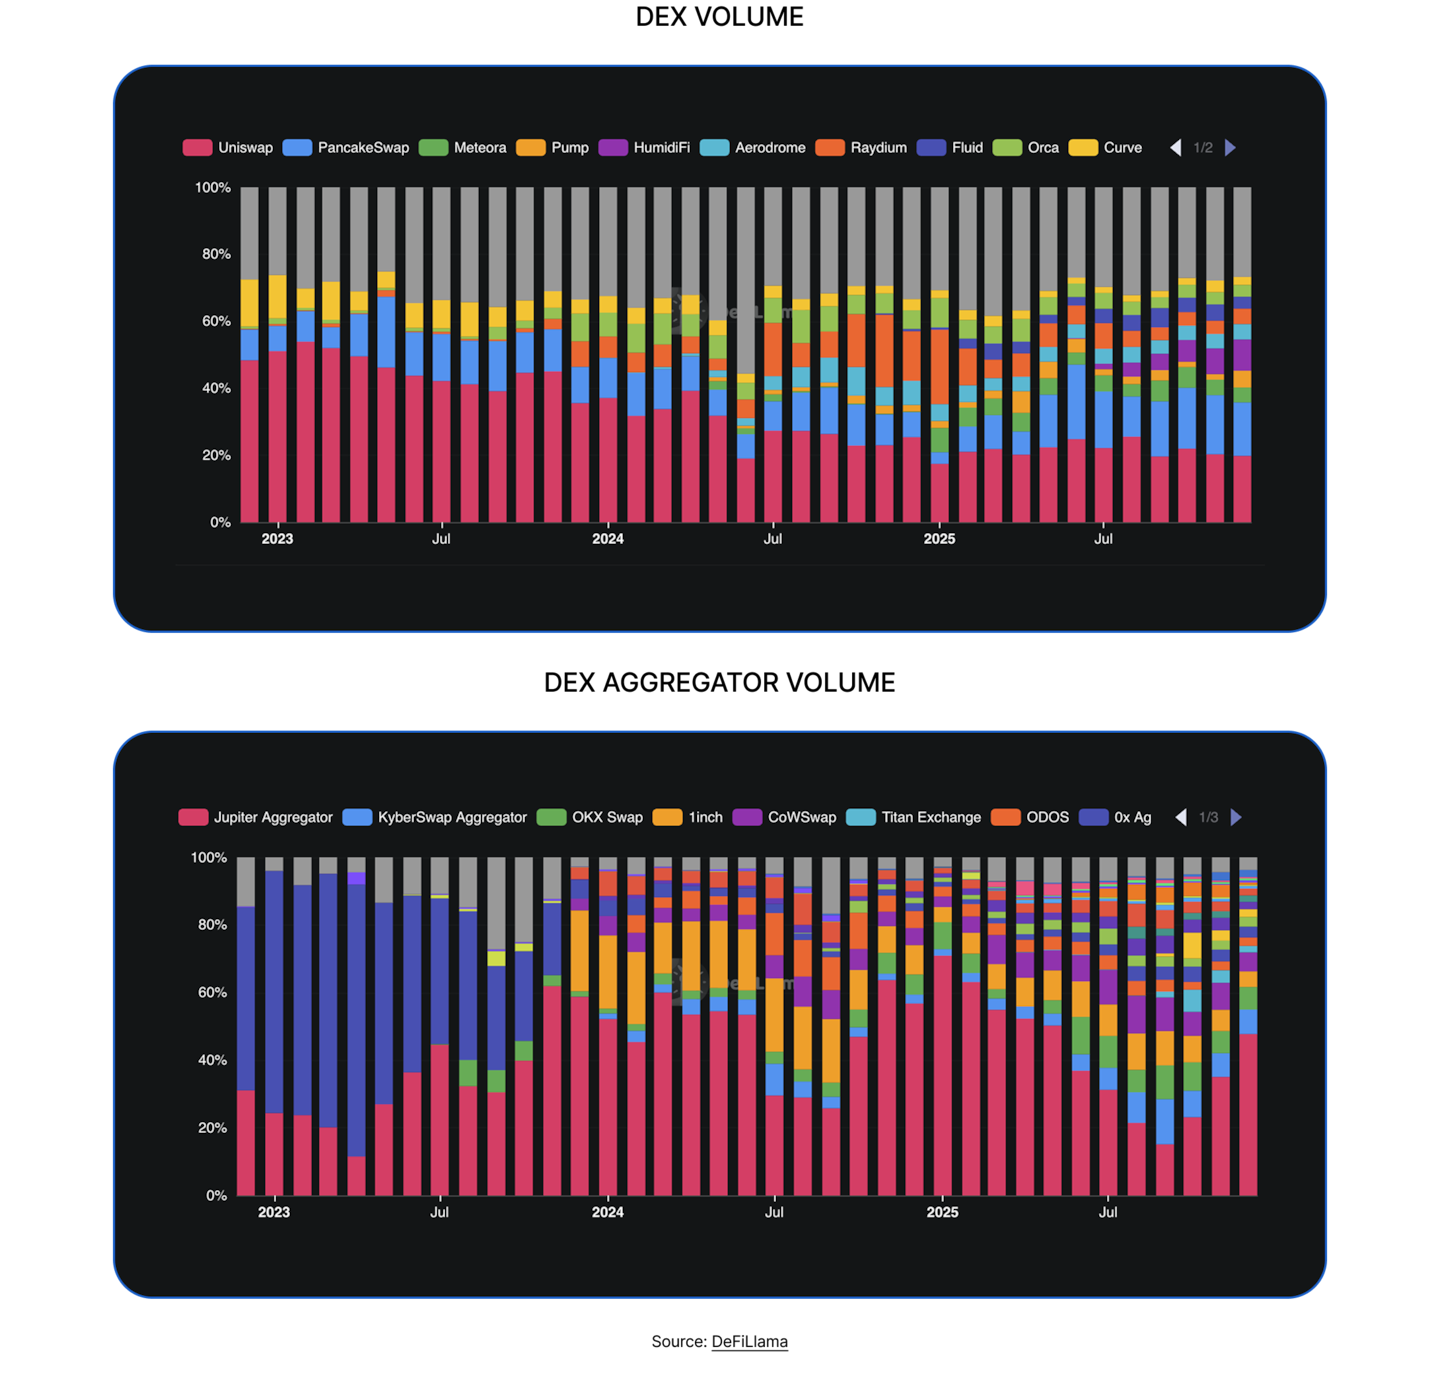
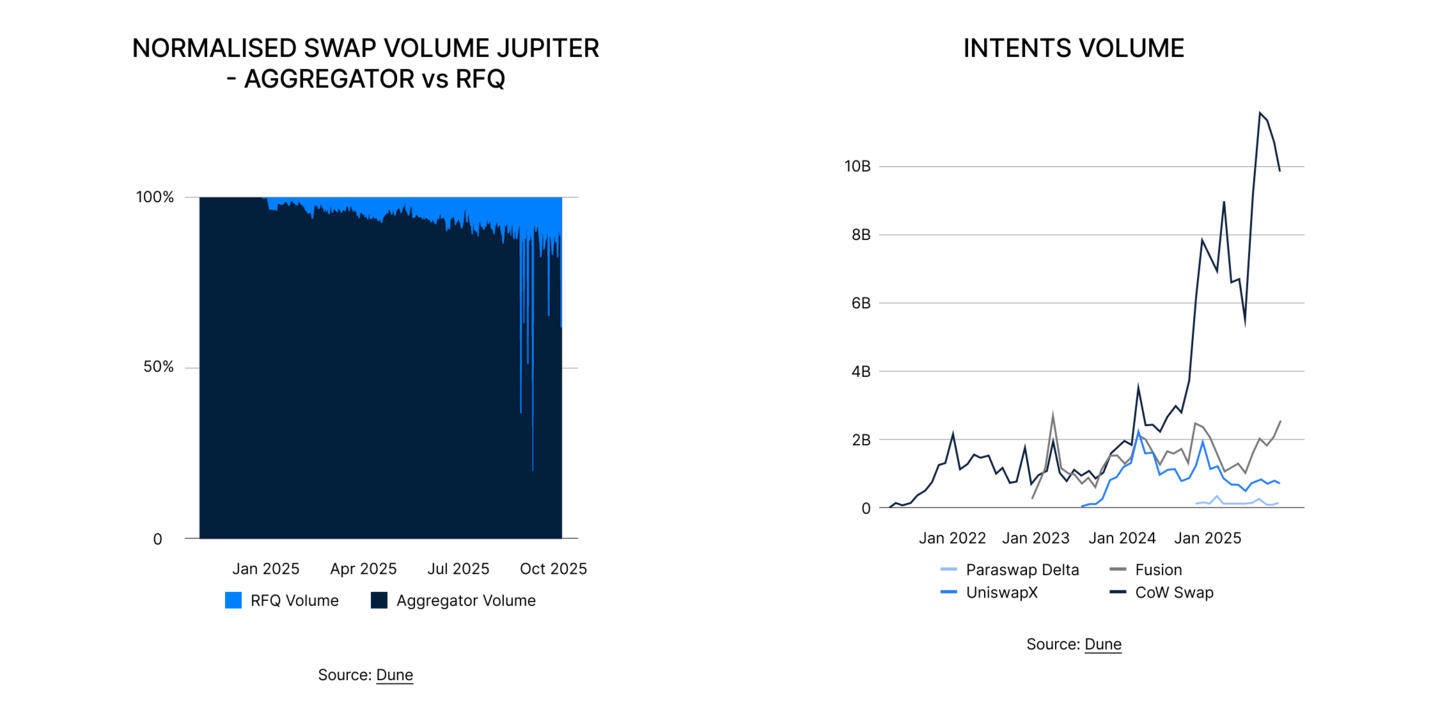
The most visible change is the decline of unilateral dominance. In 2023, three protocols (Uniswap, Curve and PancakeSwap) accounted for roughly 75% of all DEX volume. By 2025, that same share is split across around ten protocols. Aggregators experienced the same shift. What was once an 80% duopoly between Jupiter and 0x has now fragmented into more than ten meaningful participants. This redistribution mirrors patterns seen across the broader DeFi landscape: as infrastructure becomes cheaper and cross-chain liquidity easier to access, competition increases and fee capture becomes more widely distributed.
This shift is not only competitive but architectural. The DEX experience has progressively abstracted away user decisions. The first generation of AMMs required traders to choose a specific pool. Aggregators, the second layer, removed this step by routing across venues. A third wave is now emerging: intent-based execution. Users express the outcome they want, not the path to achieve it, and solver networks determine how to fulfil that intent, often spanning chains, liquidity layers and bridging systems in a single action.
Within this wave, several execution models are competing or complementing one another: RFQ systems, solver-based batch optimisation, CLOB-style matching and professional market-maker involvement. Together, these designs point toward a future in which routing, bridging, matching and settlement become invisible to the user. Execution is determined not by where liquidity resides but by which mechanism can deliver the best possible final price.
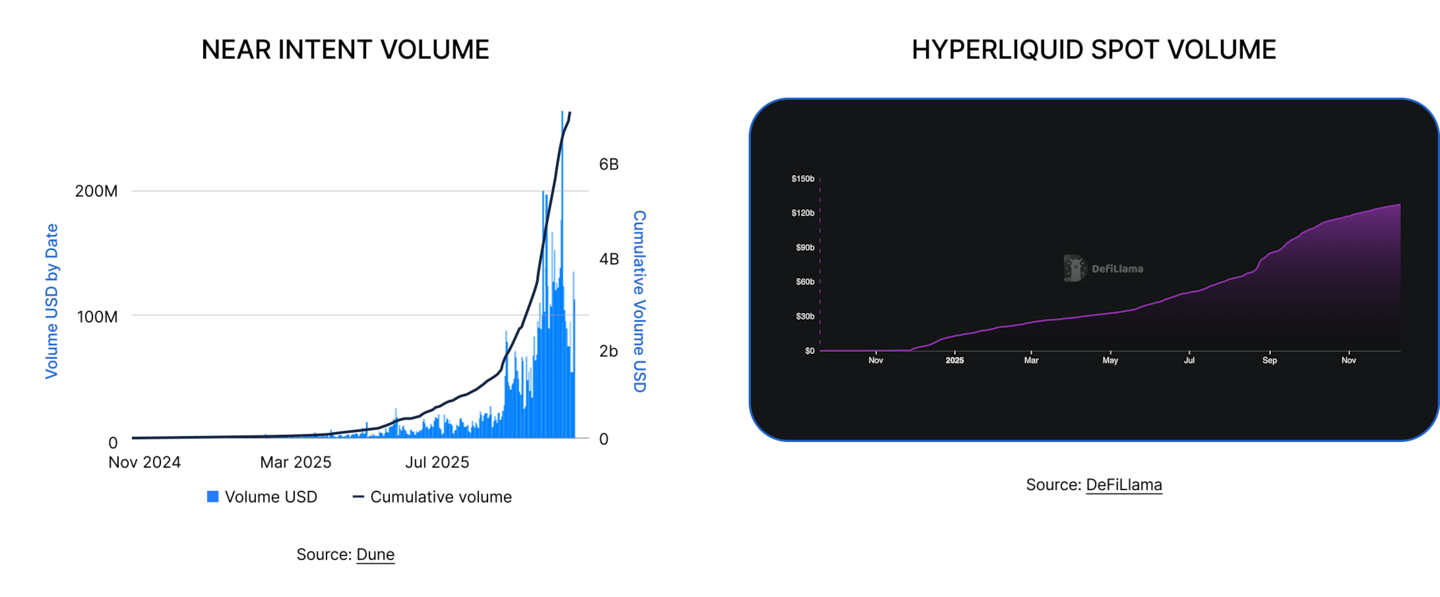
The data shows how quickly this shift is taking hold. NEAR Intents grew from roughly 3 million dollars in cumulative volume at the start of 2025 to more than 6 billion by year-end, an increase of more than 200,000%. CoW Swap’s monthly volume increased fivefold compared with late 2024, reaching 10 billion dollars per month. Jupiter’s RFQ system is steadily eating into the market share of its classic aggregator, while Hyperliquid’s spot orderbook grew from 12 billion to 125 billion dollars in 2025, a tenfold increase. Across these examples, the pattern is the same: users are moving away from direct pool interaction and toward systems that guarantee best execution regardless of where liquidity sits.
This raises the question of long-term direction. As markets mature, the architecture increasingly resembles centralised exchange infrastructure: orderbooks, deep liquidity, unified routing layers and seamless chain abstraction. Whether this infrastructure will ultimately be powered by fully decentralised systems, hybrid CeDeFi designs or a blend of solver-driven networks remains uncertain. CeDeFi currently appears ahead in performance, but the possibility of a high-performance, permissionless alternative cannot be dismissed.

What is clear is that DEXs are entering a new competitive phase. As more entrants emerge, execution models surface and user expectations rise, protocols are being pushed to deliver better routing, lower costs and more reliable execution. The result is a trading environment that is richer, more diverse and increasingly shaped by abstraction. Swapping is no longer about choosing a venue, it is about expressing an intent and letting the network decide the rest.
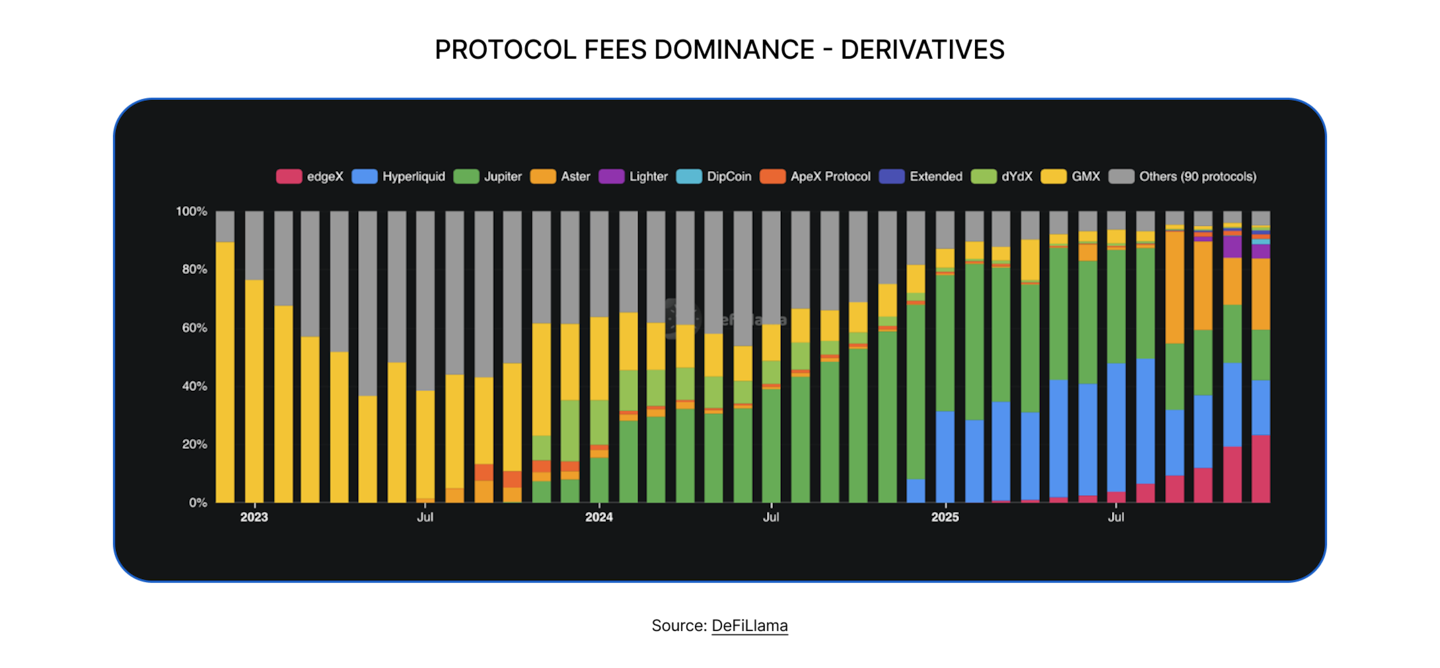
Perps: A Market Becoming Institutional-Grade
Onchain perpetuals entered 2025 as one of the fastest-growing pillars of DeFi. Weekly trading volume expanded from roughly 50 billion dollars in 2024 to more than 250-300 billion in 2025, pushing cumulative volume from around 4 trillion in January to more than 12 trillion by year-end. Their share of global derivatives activity rose sharply as well, increasing from roughly 2.5% of CEX perpetual volume in early 2024 to around 12% in 2025.
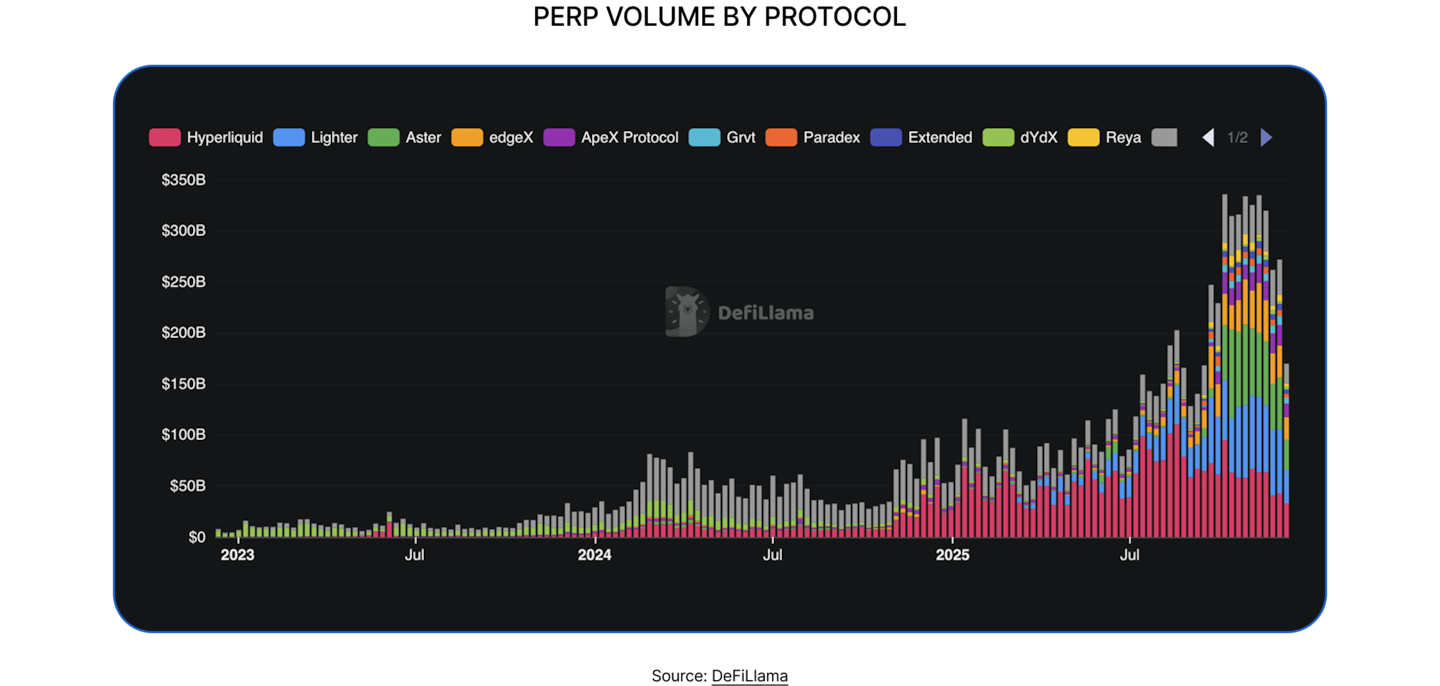
Open interest tripled from around 30 billion to nearly 90 billion in 2025, signalling deeper liquidity and stronger capital commitment onchain. Higher OI reflects traders keeping positions open longer and greater confidence in the stability of these venues. At the same time, liquidity became more distributed: Hyperliquid’s share fell from roughly 75% to about 44% as competitors scaled. This broader spread of OI marks a healthier sector structure, reduced concentration risk and a derivatives landscape that is maturing beyond a single dominant venue.
The competitive map transformed just as quickly. At the start of 2025, Hyperliquid and Jupiter Perps captured more than 60% of market share. By year-end, Hyperliquid, Aster, Lighter and EdgeX each controlled roughly 15-20% of trading volume, while Jupiter held closer to 10%. Five protocols now account for almost 70% of all onchain perps volume. This is no longer a market shaped by one or two incumbents but a genuinely competitive derivatives ecosystem.
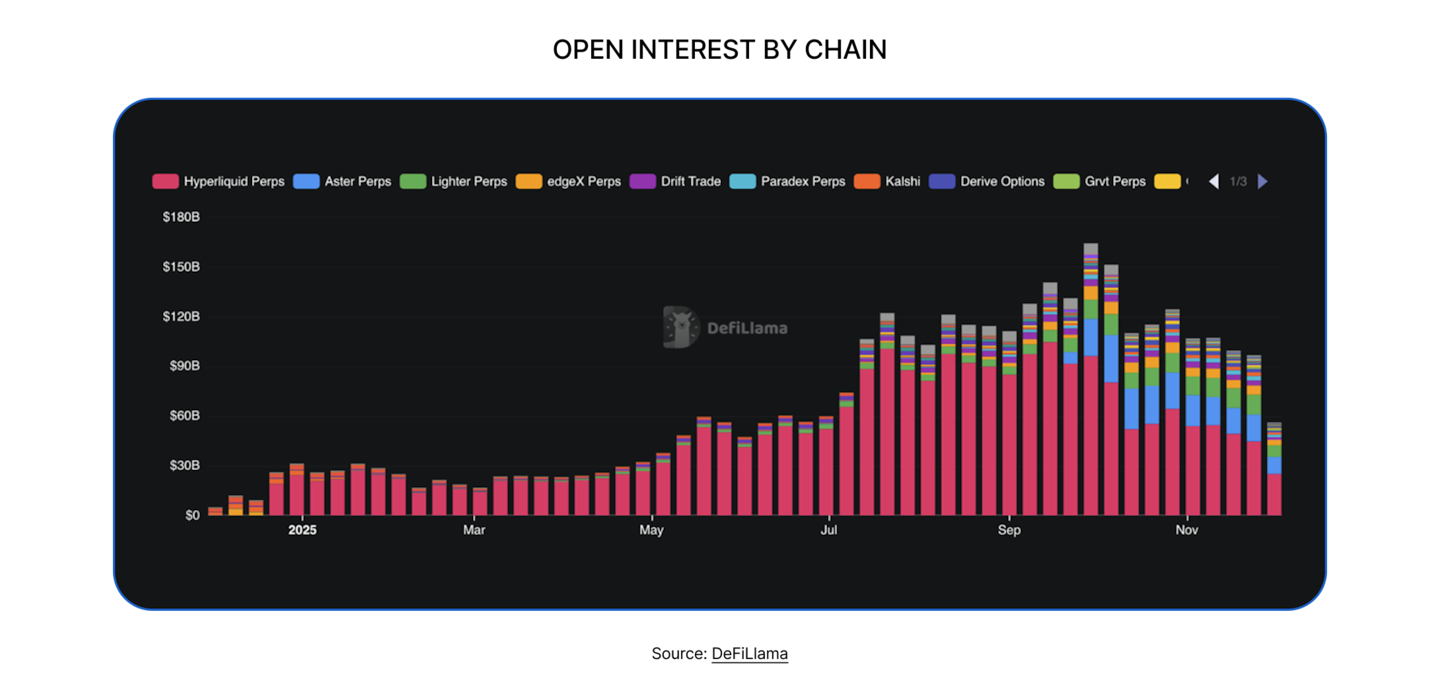
The rise of chain-specific perps environments further reinforces this shift. While Ethereum and Arbitrum together represented nearly 70% of perps volume in 2024, the centre of gravity has now moved to purpose-built execution layers. dYdX’s earlier migration to Cosmos was the first signal. Today platforms such as Hyperliquid, EdgeX and Lighter dominate volume on their own chains, and a parallel wave of offchain engines with onchain settlement is emerging. This reallocation of liquidity shows that perps are no longer tied to general-purpose Layer 1s or Layer 2s. They gravitate instead toward environments offering high throughput and predictable execution.
Behind this shift lies an even deeper transformation: the architecture of onchain perps has fundamentally changed. The early generation of platforms, including GMX and vAMM-based protocols, relied on vault models where LPs absorbed directional risk and execution quality was limited by AMM curves, oracle cadence and block-level latency. These systems were easy to bootstrap but structurally unable to support professional flow. Spreads widened sharply in volatile markets, LP inventories destabilised during liquidations and capital efficiency lagged meaningfully behind CeFi.
The 2025 entrants inverted this equation. Hyperliquid, Aster and Lighter operate with exchange-grade matching engines and orderbook-based execution, delivering near-instant matching, predictable queueing and tight spreads. Vertex and Drift use hybrid designs, combining offchain or semi-offchain orderbooks with onchain risk and settlement, achieving much lower latency than traditional EVM-native AMM architectures. Together, these models enable what early AMMs could not: a trading environment in which market makers can quote efficiently, hedge exposure, provide deep liquidity and manage inventory using tooling similar to what they use on centralised exchanges.
Margin and collateral systems have advanced in parallel. GMX-style isolated collateral constrained leverage and prevented risk from being netted across markets. The newer cohort converges on cross-margin and unified collateral, allowing unrealised PnL to offset losses and improving capital efficiency significantly. Hyperliquid’s portfolio margining, Vertex’s sub-account structure and Aster’s multi-collateral model all reflect the same idea: a risk engine that behaves much closer to institutional-grade exchange infrastructure.
Liquidation logic also improved. More robust price feeds, batch and auction-style execution and slippage-aware mechanisms reduce tail risk and create healthier leverage profiles at the system level. These changes allow platforms to support larger positions and more professional liquidity provision with more predictable liquidation pathways.
Taken together, these architectural upgrades have reshaped liquidity behaviour. For the first time, professional market makers and funds can participate meaningfully onchain at scale. Deterministic matching, deeper orderbooks, unified collateral and chain-specialised execution environments reduce operational risk to levels acceptable for institutional strategies. RFQ layers, filler incentives and more competitive execution flows, visible across Aster, Drift and Jupiter’s RFQ system, reinforce this by turning execution itself into a competitive marketplace rather than a single fixed pathway.
In short, the trading environment has become the key differentiator. The question is no longer whether onchain perpetuals can function, but whether their microstructure is comparable to CeFi. In 2025, the answer is increasingly yes.
This maturation positions onchain perps to attract institutional participation in a way that was not realistic in 2021–2023. Deeper liquidity, more robust risk engines, chain-specific throughput, lower fees and more predictable execution collectively remove many of the historical barriers for funds, market makers and structured-product desks. Onchain derivatives are evolving into a credible, operationally reliable market that competes directly with centralised exchanges.
Looking ahead, the next stage of evolution is likely to centre on collateral mobility, cross-chain margining and the unification of liquidity across execution environments. As the market fragments across specialised chains, the winners will be those that can deliver seamless collateral portability, low-latency settlement and deep liquidity without sacrificing trust minimisation.
If 2025 was the year CLOB- and cross-margin-based perp DEXs proved they could scale, 2026 will be the year they begin to converge toward fully institutional-grade trading infrastructure while offering unique products such as RWA-Perps.
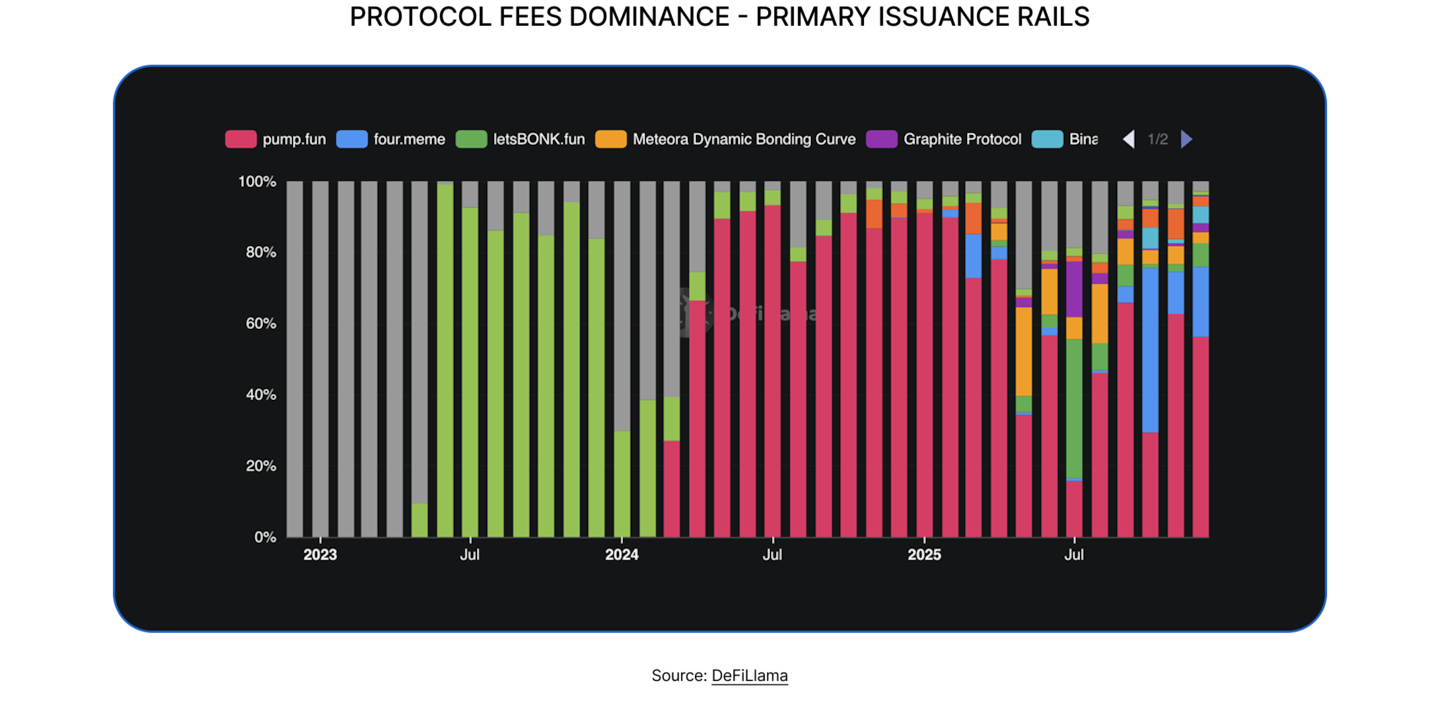
Primary issuance rails and the new speculative economy
Primary Issuance
Primary issuance rails became one of the defining narratives of 2025. What began as a Solana-native experiment matured into a global issuance layer operating at a speed and scale unmatched in previous cycles. Pump.fun, Echo, Four.meme and comparable systems have effectively rebuilt the ICO funnel onchain, but with far greater transparency, higher cadence and a user base substantially larger than anything seen in 2017.
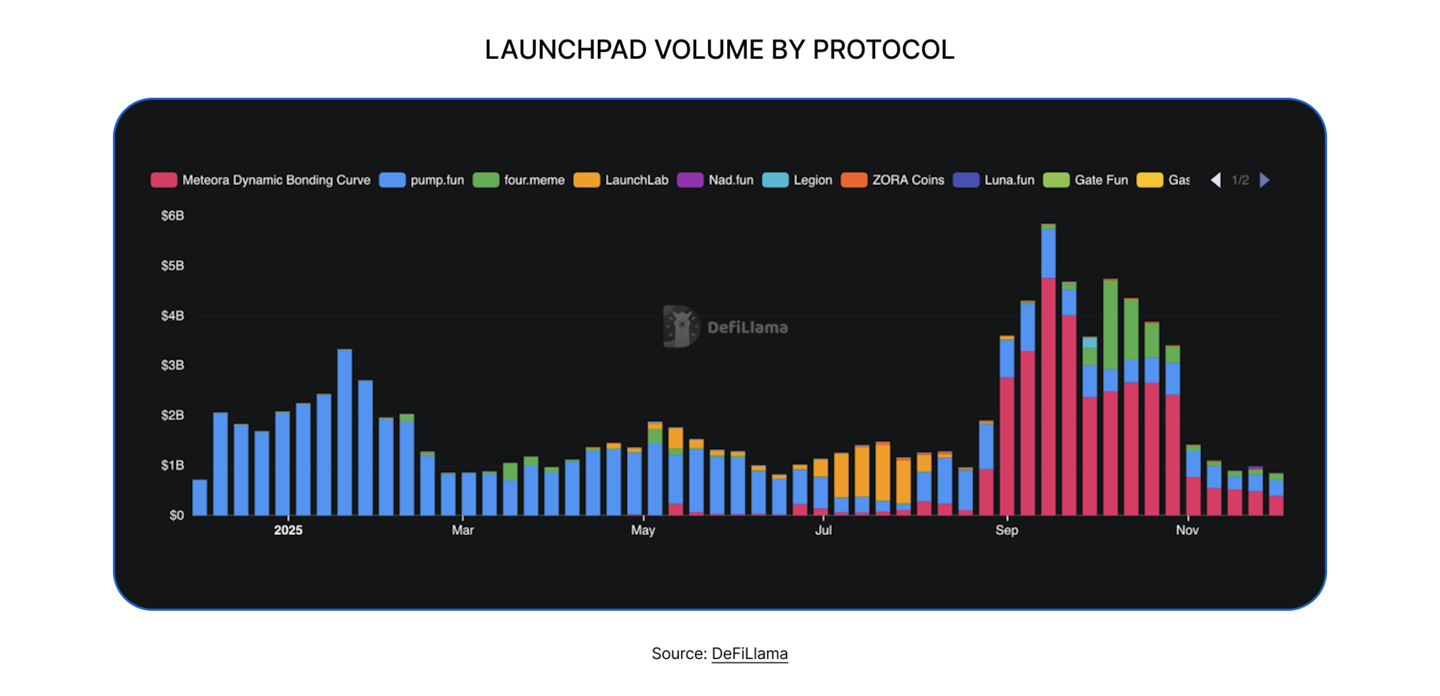
The scale of activity shows how foundational this category has become. Pump.fun alone saw between 40,000 and 60,000 new tokens minted per day at the start of 2025, stabilising to 15,000 to 20,000 by year-end. Daily active users remained above 100,000 for most of the year and reached nearly 300,000 during the early-year memecoin mania triggered by the TRUMP token. Revenue followed the same trajectory. Cumulative fees increased from $285 million at the start of the year to $920 million, which is remarkable for a platform less than two years old.

Graduation into deeper liquidity venues followed a consistent pattern. Out of the roughly 14 million tokens created on Pump.fun, only about 150,000 (1.07%) progressed to Raydium or PumpSwap, where liquidity becomes meaningful and early price discovery develops. Four.meme displayed a similar trend: around 764,000 tokens were issued, with approximately 10,000 ultimately listed on PancakeSwap.
Despite the short-lived nature of most issued tokens, this activity does not cannibalise DeFi. Instead, it creates temporary shifts in attention that coincide with periods of heightened speculation, such as early 2025. Surges in Pump.fun usage correlate with spikes in Solana DEX volume, rising funding rates on perpetuals and increased noise trading across platforms. Far from draining liquidity, these platforms onboard new users at scale. Many enter through memecoin issuance and eventually remain in the ecosystem, migrating toward other primitives such as DEXs, perps and yield products.
Beyond memecoin-driven issuance, more curated platforms targeting early-stage investment have also emerged, such as Echo. Since its launch in March 2024, it has facilitated more than $150 million in primary issuance, peaking in January 2025 before stabilising at 10 to 20 deals per month and $5 to $15 million in monthly funding.

Compared to 2017, the contrast is stark. The ICO wave was defined by opacity, slow cadence and fragmented access. The 2025 issuance cycle is the opposite. It is transparent, constant and directly integrated into efficient liquidity tools. Issuance rails have become the attention layer of DeFi, a set of markets where distribution, virality and speed often matter more than underlying fundamentals. Economically, they behave closer to social platforms than traditional exchanges.
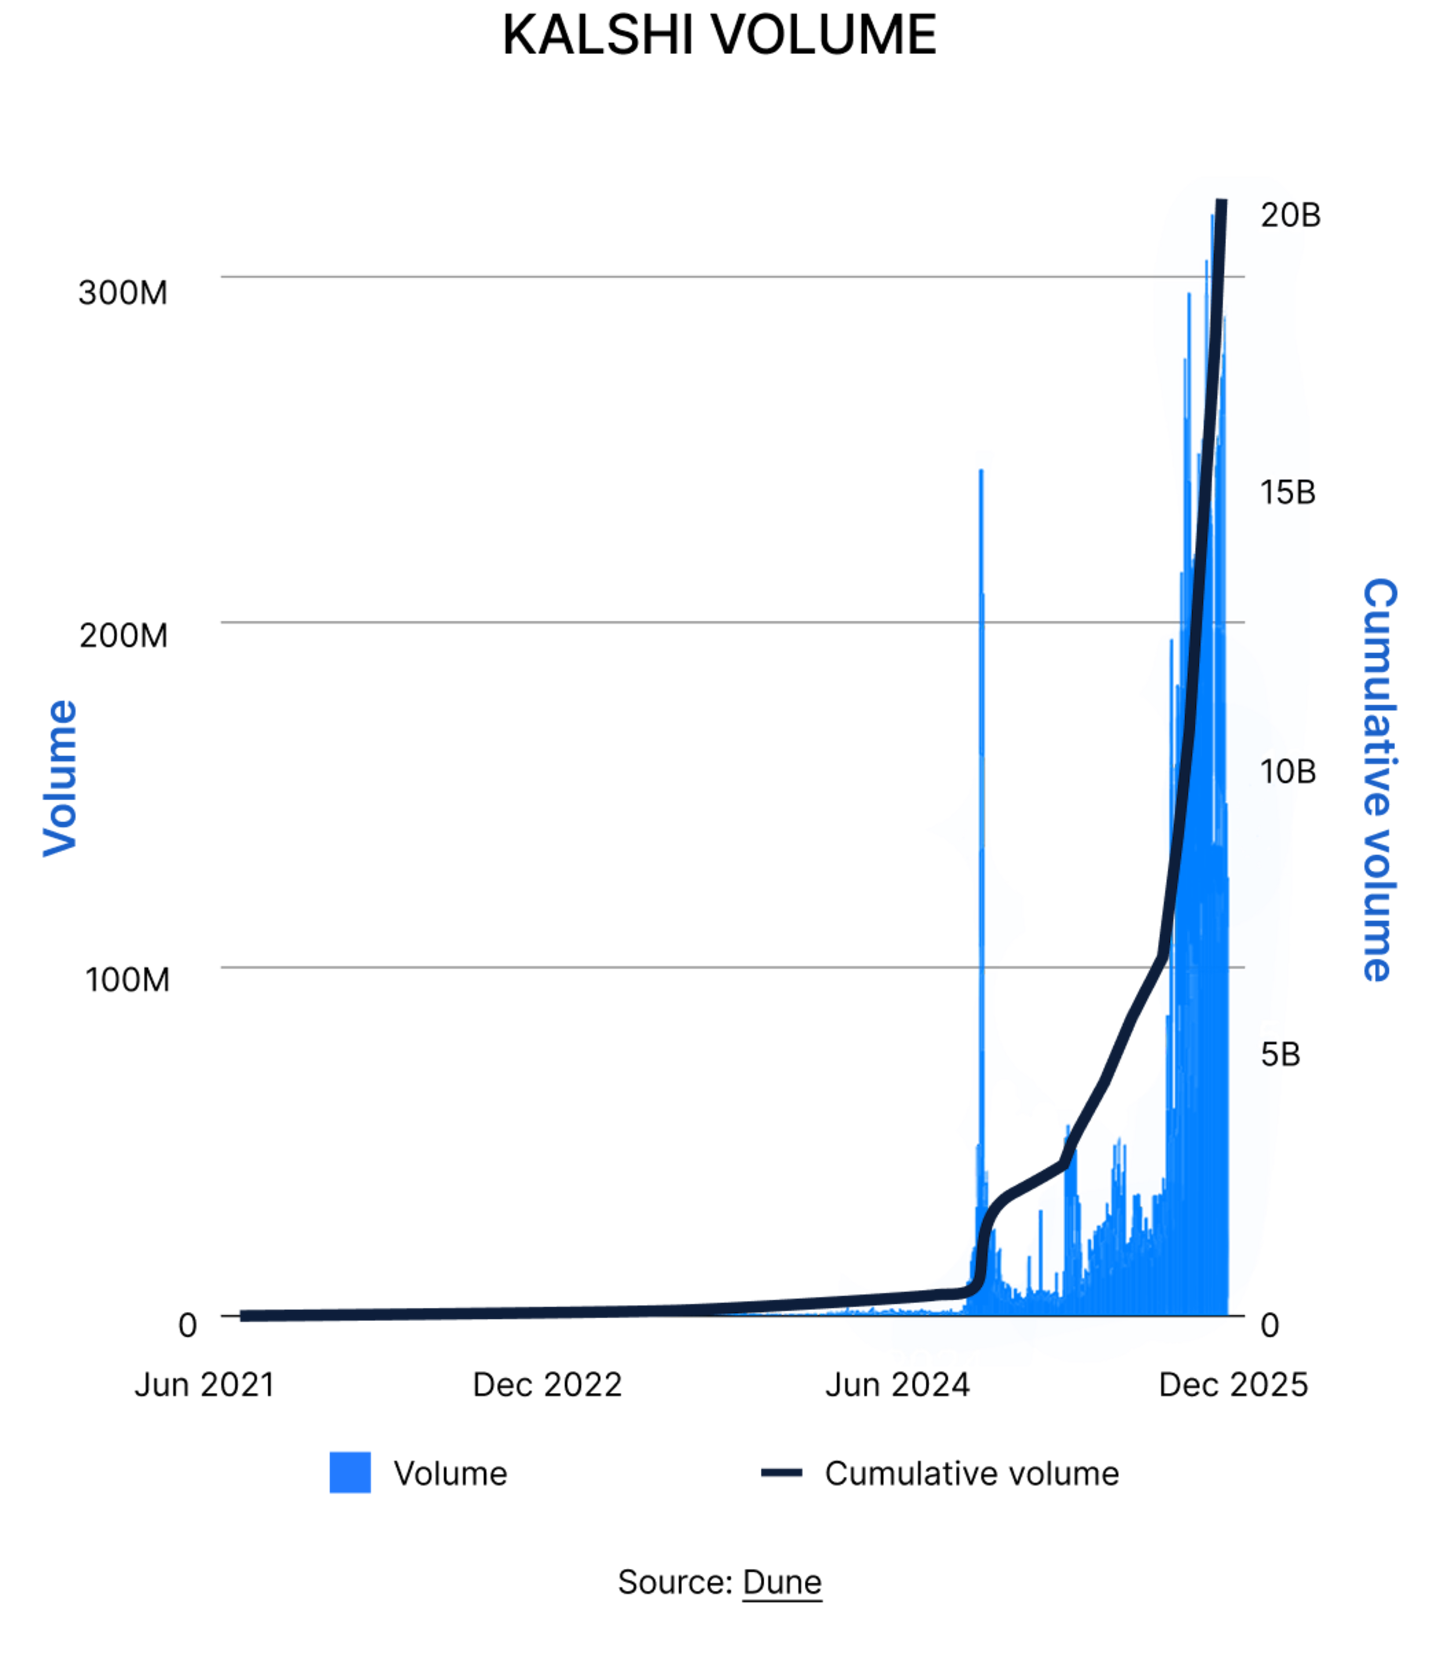
Prediction Markets
Prediction markets have emerged as another important component of this speculative layer. Platforms such as Polymarket and Kashi have moved from niche to mainstream. Polymarket reached a peak of 130,000 daily users, compared with roughly 50,000 at the start of the year. Daily transactions rose from around 400,000 to more than 1.3 million, and daily volume now ranges between $70 million and $100 million. Cumulative volume has exceeded $26 billion.
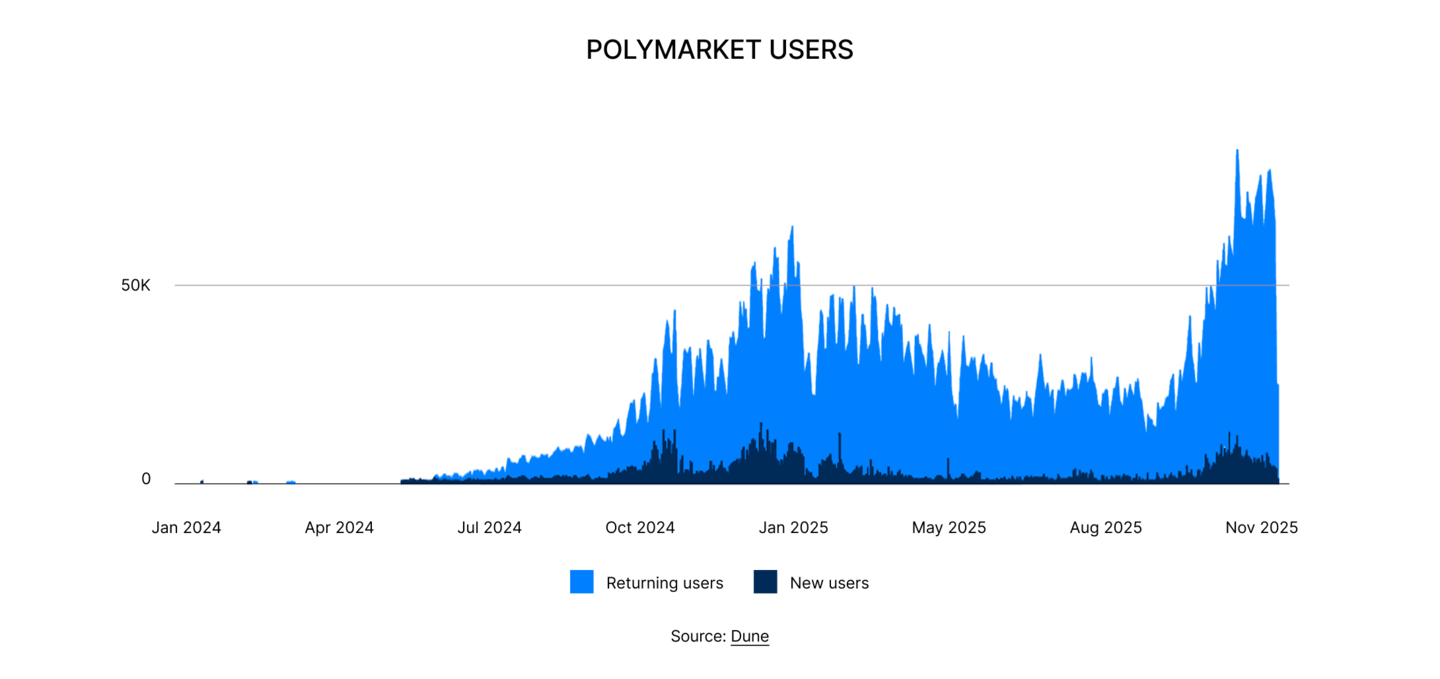
Kashi has followed a similar trajectory, with daily volume between $150 million and $200 million and cumulative volume of around $16 billion. These markets function like micro-perpetuals on real-world events, and their pricing often influences assets that proxy similar political or macro outcomes. For the first time, event-driven flow is becoming a measurable contributor to the DeFi liquidity stack.
Three developments in 2025 demonstrated why prediction markets are no longer a curiosity but a structural information engine. First, they consistently repriced political and macro outcomes faster than traditional sources. During the US presidential debates, for example, Polymarket odds moved within seconds of key moments, long before polling aggregators or news desks updated their models. Second, these markets now bleed directly into DeFi behaviour. Election-linked positions on Polymarket were followed by shifts in funding rates on ETH and SOL perpetuals, as traders hedged or amplified directional bets based on changing probabilities. Third, prediction markets unlocked a new form of event-driven user behaviour. During major catalysts such as CPI releases, court rulings or sports finals, liquidity rotated visibly between meme platforms, perps and prediction markets. Users moved where narratives moved, turning these events into short-cycle sources of flow for the broader ecosystem.
Interconnected and Outlook
What initially seemed like separate trends are converging toward a single structural outcome. The crypto trading stack is evolving into a more complete, interconnected and continuous system than at any point in its development.
At the top of the stack, issuance platforms supply an unprecedented flow of new assets, attention and users. Whether through mass-market rails like Pump.fun or more curated venues like Echo, issuance now acts as the ignition point of speculative cycles. These flows do not stay siloed. They feed directly into DEX routing and perps products.
In the middle of the stack, DEXs and perps transform that flow into deeper trading activity. Sophisticated matching engines, unified collateral models and exchange-grade execution have allowed Perp venues to absorb institutional-scale liquidity while DEX infrastructure increasingly acts as the universal router of onchain value. Activity rotates rapidly between issuance, spot markets and derivatives, but it does so within a coherent execution environment that is far more efficient than in previous cycles.
Prediction markets complete the stack by acting as an information and catalyst layer. Their probability signals influence positioning across perps, funding dynamics and short-term sentiment. They turn real-world events into tradeable markets, providing a live input into the broader price discovery system.
These layers now operate in a self-reinforcing loop. Issuance captures attention, attention fuels trading, trading expands derivatives demand, and derivatives positioning shifts with event probabilities. Crypto has moved beyond fragmented speculation into a circular liquidity system where each layer accelerates the others.
Credit, Yield, Staking, Restaking, And RWA Collateral


Vaults and yield aggregators are now a major entry point into DeFi; what distinguishes a mature vault and curation ecosystem from the earlier “chase the highest APY” phase of the market?
A mature vault ecosystem starts with a risk-first approach where yields are decomposed, position limits are explicit, and strategies operate within a consistent and transparent mandate rather than simply hunting for spikes.
Governance becomes process-driven rather than reactive, enforced through automatic execution pipelines, and users are given visibility into asset allocation. In that sense, the distinction is not the sophistication of the strategies, but rather the presence of an actual investment process behind them, one that looks more like portfolio management and less like yield farming.
As collateral types expand from ETH and stablecoins into LSTs, LRTs, and RWAs, what principles do you think should govern which assets are considered suitable for conservative yield strategies?
Conservative strategies should have explainable, observable, and controllable risk exposure, at least to a high degree of certainty. LSTs, LRTs, and RWAs introduce very different forms of technical, operational, and legal risk, so suitability depends on how transparent and predictable those risks are, especially under stress.
A critical criterion is the degree to which risk assessment relies on off-chain information. The more an asset depends on private agreements, unverifiable legal claims, or discretionary operator behavior, the harder it becomes to accurately price its risk inside an onchain strategy. Conservative vaults therefore favor assets whose essential mechanics e.g. validator performance; slashing exposure; redemption conditions; NAV calculation; duration mismatch; can be monitored and validated directly onchain. When off-chain components exist, they should be minimized, standardized, and backed by strong, transparent reporting, so that risk is not dependent on information asymmetries or trust gaps.
Many treasuries and funds now face a menu of restaking, credit, and RWA products; how do you expect their approach to portfolio construction to change as curated vaults become more common?
Many funds make allocation decisions on a per-position basis, often stretching themselves to understand a wide range of investment opportunities. As curated vaults mature, hybrid portfolio allocation frameworks are emerging, where funds retain direct control over certain high-conviction exposures but delegate a portion of assets to simpler, more constrained mandates that are executed by reputable counterparties.
These mandates have clearly defined investment universes, liquidity parameters, and risk limits, and they operate with quasi-automatic execution, which makes them cheaper to operate. This balance enables funds to maintain strategic discretion while offloading the operational burden of continuous monitoring, rebalancing, and risk assessment for the more predictable components of their portfolios.
We’re seeing this happening already in our curated vaults, where most of their supply/borrow liquidity is coming from yield aggregator vaults and liquid funds.
RWA and tokenized credit products now sit side by side with permissionless DeFi strategies; what kind of curation or rating framework do you consider necessary before these assets can be mixed in the same vaults at scale?
We can already see meaningful dispersion in onchain credit yields. Permissionless lending markets like Aave and Morpho typically price senior stablecoin credit around the 4–7% range depending on utilization. Tokenized private credit platforms e.g. Goldfinch; Maple often offer 9–13% yields for diversified senior or senior-secured pools, with higher rates for mezzanine or emerging-market exposure. Meanwhile, short-duration RWA Treasury products have recently been yielding 3–5% on fully collateralized U.S. T-bill exposure. These differences reflect not just market conditions but the underlying risk stack, and highlight exactly why a consistent rating framework is necessary before mixing these assets at scale.
Credible frameworks should assess both onchain and offchain risks as first-class, measurable attributes: smart-contract audits, protocol governance, oracle design, liquidity behavior, NAV accounting, legal enforceability, counterparty trust, collateral quality, etc.
These metrics can’t be measured on a one-time underwriting exercise. They should also include ongoing, automated monitoring, so that risk is not merely evaluated at inception but continuously supervised throughout the life of the asset.
Automation and agent based systems are increasingly used for monitoring and execution; what new categories of risk or misconfiguration do you think the industry underestimates when it delegates day to day management to agents?
Automations create reflexivity. If many of them react similarly to market signals, they can amplify volatility by triggering similar execution patterns. A way to prevent these events is to implement change-control processes, circuit breakers, and a clear separation between monitoring and execution to prevent automation from becoming a systemic risk.
Another underappreciated risk is configuration drift: small, unnoticed changes to agent parameters or external data sources that meaningfully affect behavior. At kpk, we maintain a simple scope and deterministic approach to agent parameterization, so we keep control of the outcomes at any point in time.
Instant exit liquidity is becoming an expectation for onchain products; how do you see this shaping the way protocols manage duration, rehypothecation, and liquidity buffers in yield markets?
The expectation of instant exit liquidity forces protocols to reconcile user convenience with the reality that many yield sources are inherently term-based. If redemptions need to be available at all times, then strategies must preserve liquidity buffers, limit how much capital is locked into long-duration positions, and reduce reliance on heavy rehypothecation.
Instant liquidity isn’t free, it shows up as lower deployment ratios, lower yields, stricter risk controls, and more active management of cash or liquid collateral. Over time, I expect protocols to explicitly segregate exposures into distinct risk classes, where liquidity becomes recognized as just another core dimension alongside duration, counterparty exposure, and strategy complexity.
Credit, Yield, Staking, Restaking, And RWA Collateral
By comparing changes in TVL, market share, fees, utilisation, and asset composition across lending, yield markets, staking, restaking, and RWA assets, we highlight how capital shifted, risks were repriced, and market structure advanced over the past year.
Lending and money markets
Lending was one of the strongest-performing DeFi sectors in 2025. Total value locked rose from $48.15 billion at the start of the year to $64.06 billion, representing a 33.0% year-to-date increase. Capital remains highly concentrated, with the top ten protocols holding $57.00 billion, or 89.0% of total lending TVL. While large platforms continue to dominate, significant shifts in market share occurred between late 2024 and late 2025.
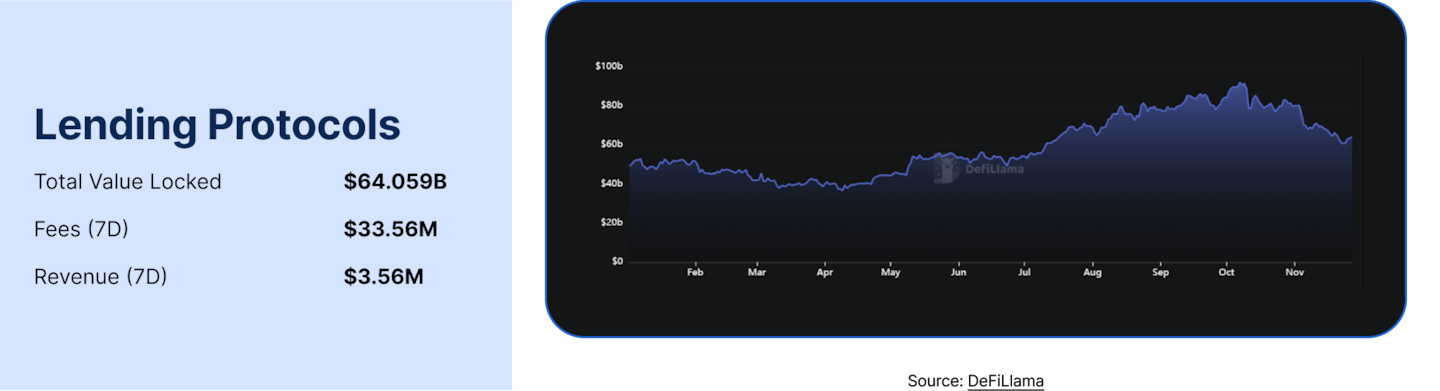
Market share shifts among the top lenders
Aave V3 strengthened its leadership position, expanding its share from 50% to 57%. This growth reflects users increasingly choosing large, proven platforms as market volatility and leverage rose in 2025. Aave benefited from serving as DeFi’s default balance sheet, offering deep liquidity, conservative risk settings, and a long history of successful liquidations that appealed to both retail and institutional borrowers.
Morpho V1 moved into second place, growing from 7.30% to 10.67%, as capital shifted toward more efficient, modular lending. Its vault-based structure allows large allocators to tailor risk and yield more precisely, aligning with the broader move away from one-size-fits-all pooled markets. Maple Finance recorded the largest relative gain, rising from 0.68% to 4.20%, driven by the return of institutional onchain credit as trading firms and market makers seek transparent, enforceable funding outside traditional prime brokerages.

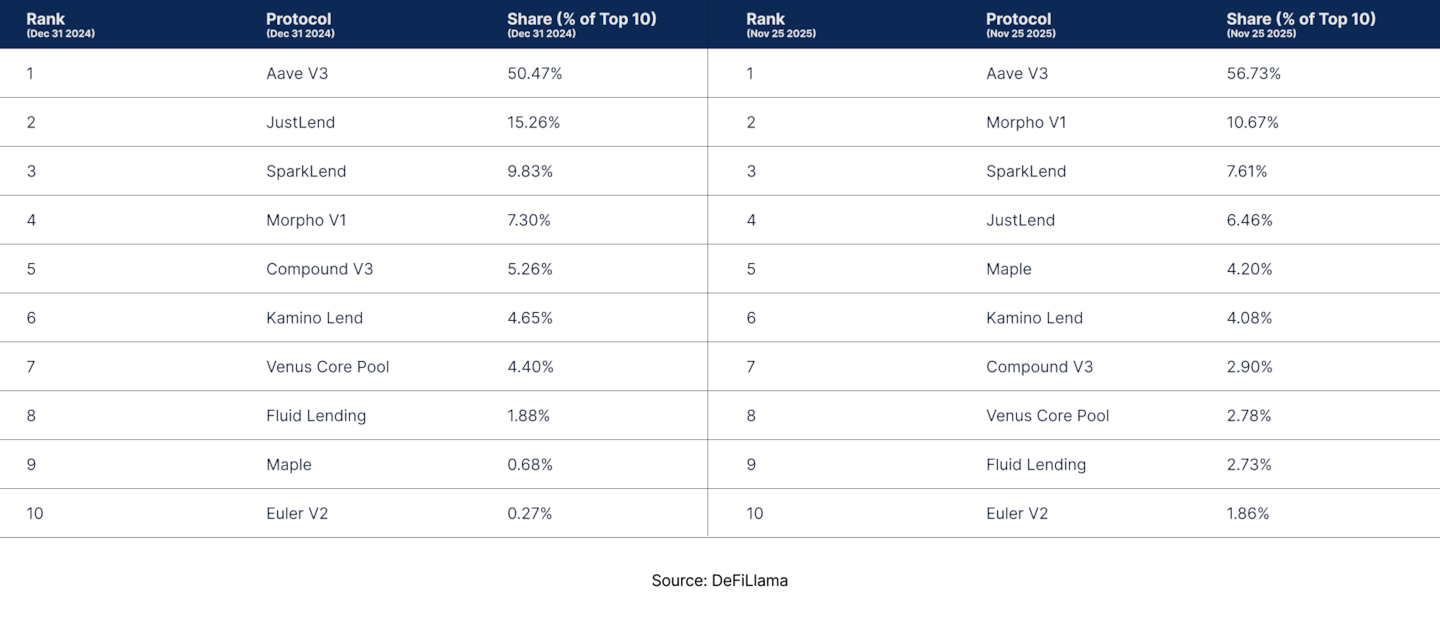
Several incumbent protocols lost market share in 2025 as liquidity migrated toward more capital-efficient designs, deeper ecosystems, and venues viewed as operationally stronger. At the same time, a small number of recovering or structurally advantaged platforms gained ground:
- JustLend: Share fell from 15.26% to 6.46% as leverage and new structured products concentrated on Ethereum and major Layer 2s rather than Tron.
- SparkLend: Declined from 9.83% to 7.61% as growth lagged faster-scaling, more capital-efficient competitors.
- Compound V3: Dropped from 5.26% to 2.90% after pausing key stablecoin markets during the deUSD liquidity episode, which reduced borrower activity.
- Venus: Fell from 4.40% to 2.78% as BNB Chain lending became more fragmented across native venues.
- Fluid Lending: Gained market share as its integrated DEX and lending design allowed assets to be used more efficiently.
- Euler V2: Expanded from 0.27% to 1.86% following its relaunch, which restored confidence and attracted higher-utilisation capital.
Fee Generation
Fee growth largely tracked borrowing activity and rate settings, but the dispersion across protocols highlights growing differences in capital efficiency.
Some platforms generated disproportionate fee growth relative to their TVL by sustaining higher utilisation and tighter rate curves, while others with large deposit bases but lower utilisation translated far less of their deposits into revenue.

In 2025, fee capture increasingly reflected not just scale, but the ability to keep capital actively deployed through market design, risk calibration, and borrower demand. Aave, Morpho, and Kamino stood out as clear winners by converting TVL growth into outsized revenue through sustained utilisation, active borrower demand, and effective interest-rate management.
Utilisation and Market Design Differences
Utilisation levels in 2025 varied widely across lenders, largely due to differences in market architecture rather than demand alone. Protocols built around narrow, modular, or isolated markets sustained the highest utilisation. Euler V2 and Fluid Lending led the sector at 100% and 93% utilisation, reflecting designs that tightly match liquidity supply with borrowing demand and minimize idle capital through vault-based or integrated credit and DEX structures.
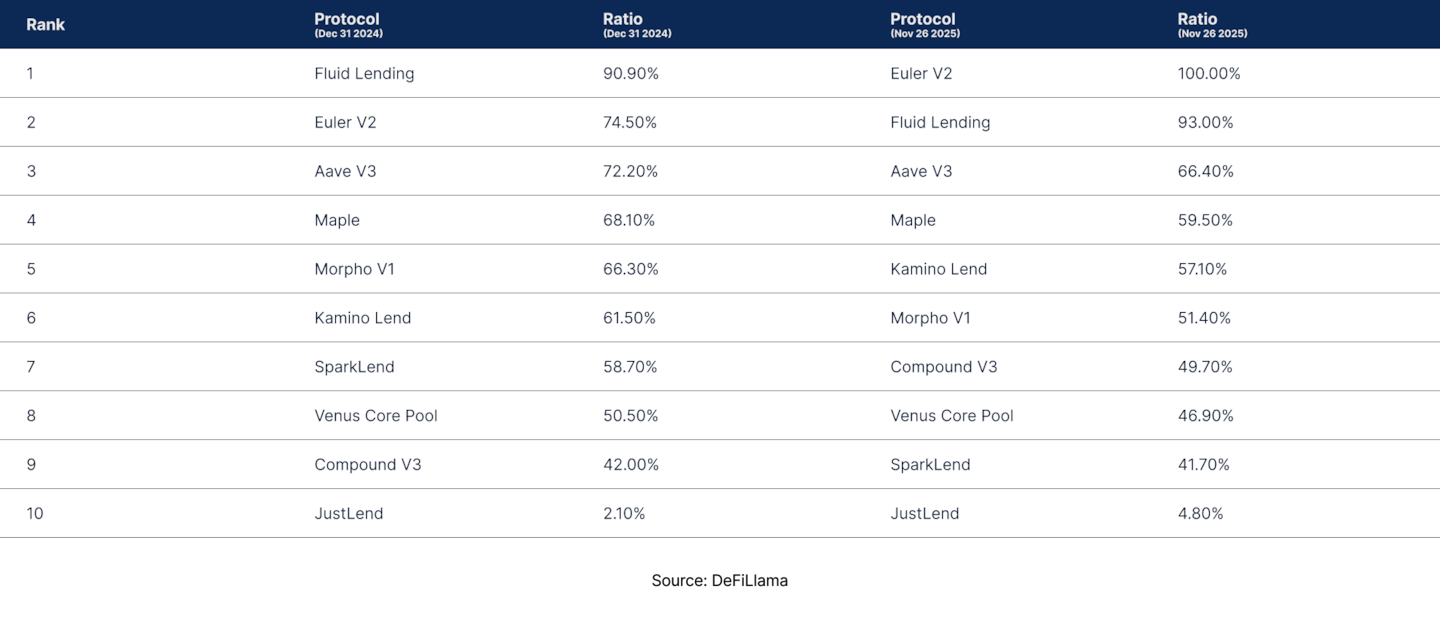
By contrast, large pooled money markets such as Aave V3 naturally operated at lower utilisation, easing from 72.2% to 66.4%, as they maintained deep reserves and conservative parameters to function as system-wide liquidity backbones. Maple followed a similar pattern, with utilisation declining to 59.5% as credit capacity expanded faster than loans were filled.
Protocols like Morpho V1 and Kamino Lend illustrate how utilisation falls as platforms scale and attract more passive liquidity, while mid-range lenders such as Compound V3 and Venus stabilised at around 47–50%. JustLend remained a structural outlier with very low utilisation due to a large passive deposit base.
Staking and Restaking
Staking remained a core source of yield and collateral in DeFi throughout 2024 and 2025, but the balance between liquid staking and restaking shifted meaningfully as risk was repriced. Below, we examine how liquid staking held up as a stable capital base, while restaking moved into a phase of consolidation following rapid, incentive-driven growth.
Liquid Staking
Liquid staking remained broadly stable in 2025 despite falling token prices. Sector TVL slipped only marginally from $58.73B to $57.62B, even as ETH fell by more than 11% and SOL remained flat. This implies continued growth in the underlying amount of staked assets, with the modest TVL decline driven primarily by dollar denomination repricing rather than reduced staking demand.
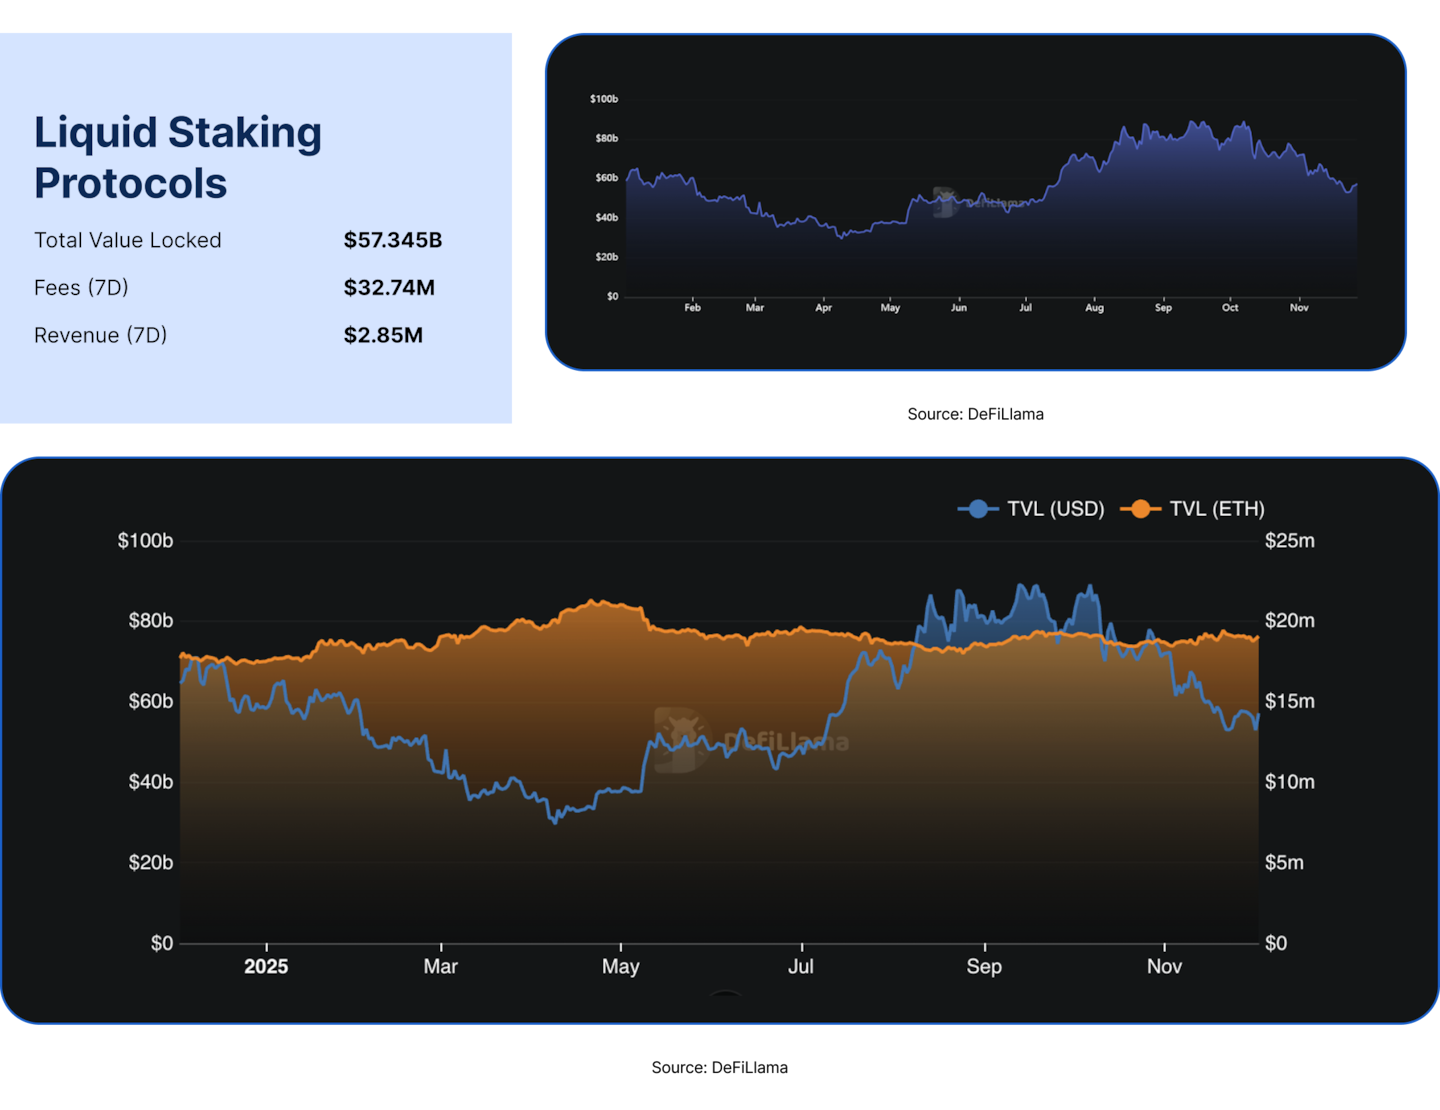
The top ten protocols continued to dominate the sector, holding over 82% of total TVL, though concentration eased slightly as newer providers gained share. Lido maintained its position as the market leader but saw its TVL fall from 32.52B to 25.52B and its share of the top ten drop from 64.7% to 53.6%. The decline exceeded ETH’s price move, indicating real market share loss as users diversified toward alternative LSTs and restaking-integrated offerings.
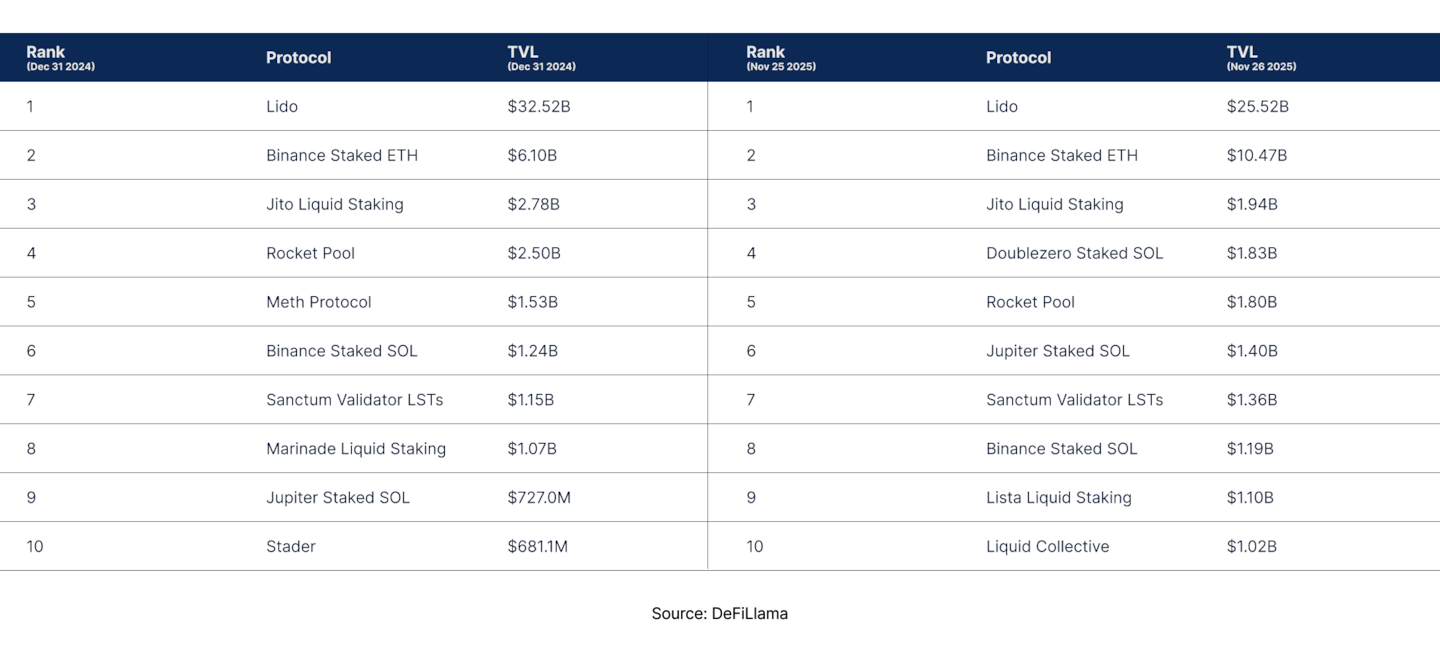
Binance Staked ETH was the major winner, growing from $6.10B to $10.47B and lifting its market share from 12.1% to 22.0%. That growth reflects the continued appeal of exchange-integrated, custodial staking tied to centralised liquidity and structured products.
On Solana, Jito’s TVL declined from $2.78B to $1.94B as competition intensified, while Jupiter Staked SOL and Sanctum Validator LSTs expanded, and new entrant Doublezero rose quickly into the top tier.
Legacy Ethereum-native protocols such as Rocket Pool saw moderate compression, while Marinade, Meth Protocol, and Stader exited the top ten entirely. They were replaced by newer institutional and cross-chain products such as Lista and Liquid Collective. Overall, liquid staking in 2025 remained a large and durable market, with capital gradually rotating away from early incumbents toward exchange-linked and institutional-grade wrappers.
Restaking
Restaking contracted materially in 2025 as yields compressed and incentive programs ended. Sector TVL fell from $23.85B to $18.78B, a 21.2% decline, far exceeding the impact of ETH and SOL price moves. Unlike 2024 and early 2025, when growth was driven by aggressive points programs and speculative AVS positioning, capital in 2025 rotated out as forward-looking yields became less compelling.
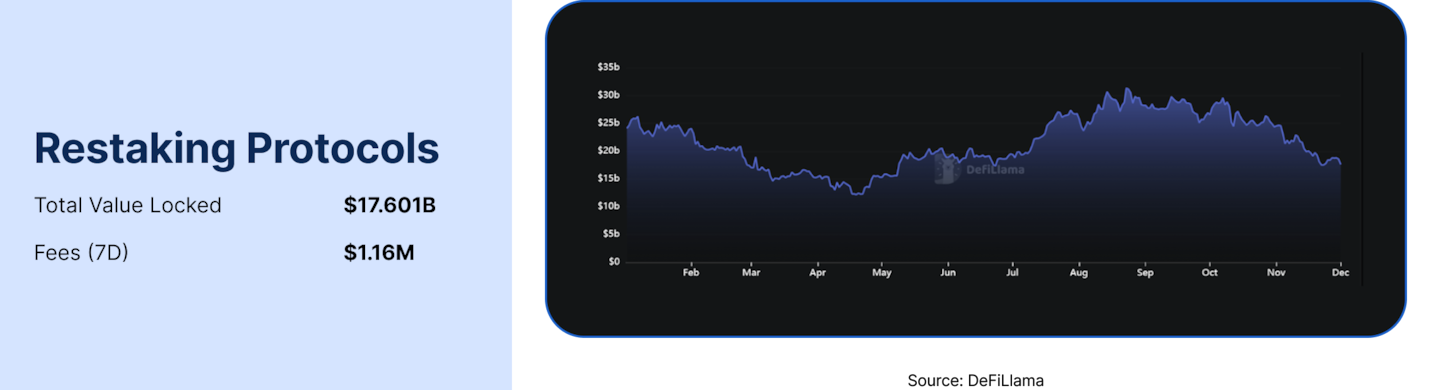
On a yield-adjusted basis, restaking now compares unfavorably even to baseline ETH liquid staking. Median ETH liquid staking yields remain around 2.6 to 3.0%, while median liquid restaking yields cluster near ~2.7%. This leaves little to no risk premium for the added complexity of restaking, including smart contract risk, slashing exposure, AVS execution risk, and multi-layer rehypothecation.

The top ten restaking protocols capture nearly the entire market and together saw TVL fall from roughly 24.0B to 18.37B over the period. As yields normalised, this group became even more concentrated, with EigenLayer and Babylon absorbing a larger share while most mid-tier platforms experienced steep outflows.
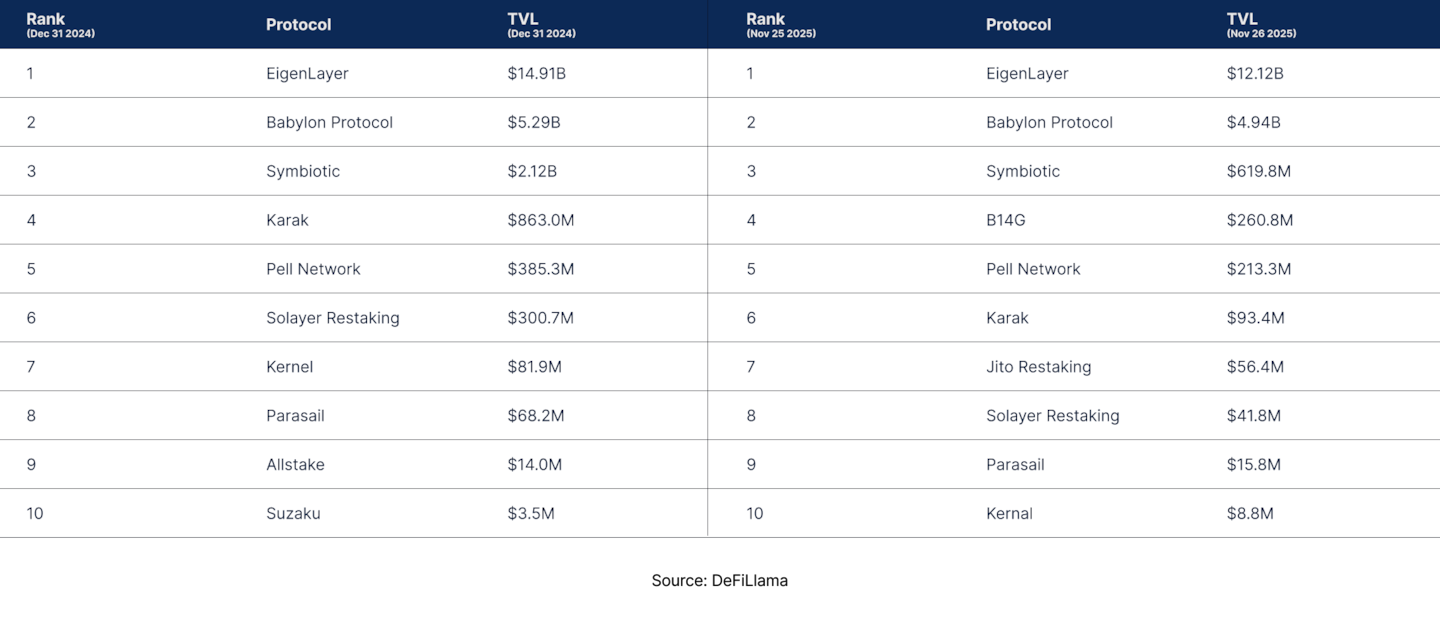
EigenLayer remained the anchor of the restaking sector. Its TVL fell from $14.91B to $12.12B as incentive-driven capital exited, yet its share of the top ten increased from 62.0% to 66.0%, showing that capital consolidated into the most established ETH restaking venue. Babylon Protocol followed a similar trend in Bitcoin restaking. TVL declined modestly from $5.29B to $4.94B, but its share rose from 22.0% to 26.9%. Many mid-tier and long-tail restaking platforms saw sharp outflows as yields normalised.
Looking ahead to 2026, the risk-to-return ratio of restaking is set to change materially. Slashing is now live on EigenLayer, meaning operators and delegators face real economic penalties for failing AVS or validator obligations. This marks a shift from an incentive-led phase to a true security-driven model. As base AVS fees remain relatively thin, the added risk of slashing is likely to weigh further on marginal restaking capital.
If AVS adoption accelerates in 2026, particularly among infrastructure-heavy and institutional use cases, EigenLayer and Babylon are best positioned to benefit due to their scale, integrations, and operational maturity. At the same time, smaller platforms will face increasing pressure as risk becomes explicit and rewards remain modest, likely driving further consolidation across the sector.
RWA and Tokenised Credit
Real-world assets moved from niche experiments to core yield and collateral infrastructure. Growth tracked the high US rate environment, with the federal funds rate sitting near 4–5% through most of 2025 and only beginning to edge lower late in the year.
This made dollar-denominated yield the main onchain attraction: US treasuries, tokenised private credit, and institutional funds offered regulated or semi-regulated ways to earn a risk-free or spread-over-risk-free return, instead of relying on emissions and governance tokens.
Private Credit
Private credit nearly doubled from $9.83B to $18.71B, making it one of the fastest-growing segments of the RWA market. Because these positions are dollar-denominated, the increase represents true capital formation, not repricing.
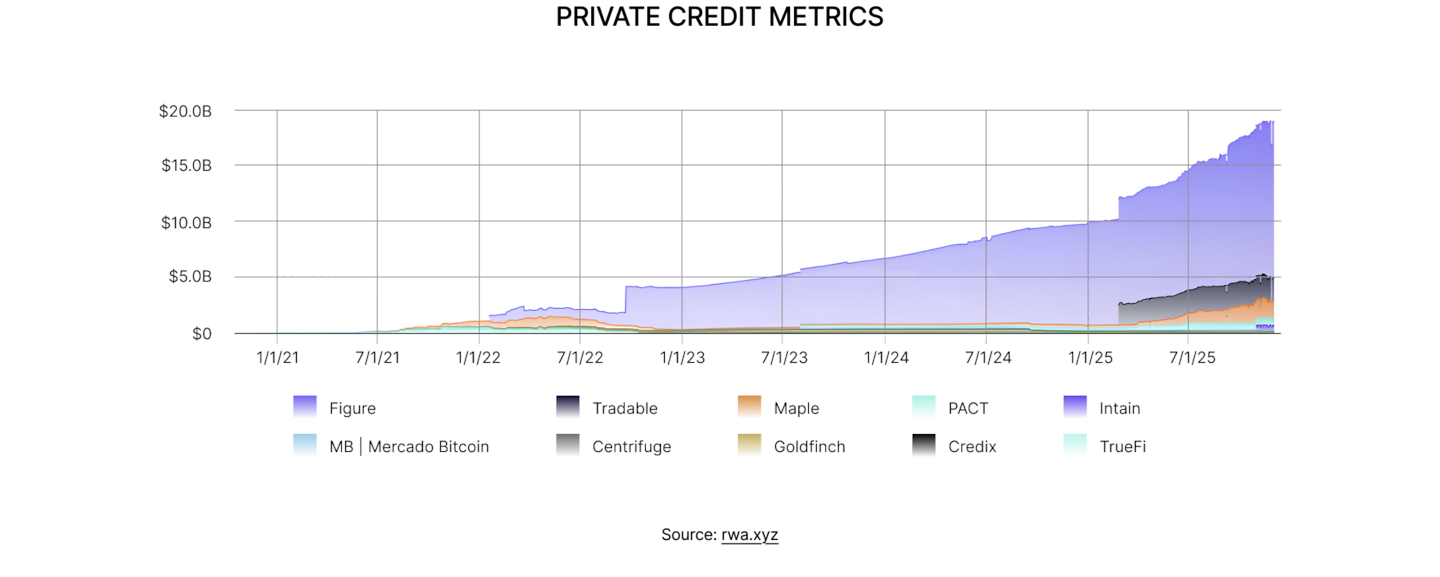
The sector also became materially more diversified. Figure remained the dominant originator, growing from $9.16B to $13.81B, but its share fell sharply from 93% to 74% as new competitors scaled.
Maple delivered the strongest relative growth among established players, increasing its outstanding loansbook from $0.27B to $1.53B and emerging as the leading institutional credit venue after Figure. Tradable and Intain appeared essentially from zero to multi-hundred-million-dollar books, together representing more than 13% of the 2025 top ten.

The common thread across the winners is institutional-grade origination. These platforms focus on repeat borrower programs, transparent underwriting, and the operational tooling institutions need for real credit allocation. In contrast, earlier DeFi-native lenders such as Goldfinch, Credix, TrueFi and Centrifuge (in its private-credit subsegment) saw flat or declining balances as capital rotated toward larger, multi-product platforms with deeper pipelines and clearer risk controls.
Looking ahead, as the US risk-free rate gradually trends lower, private credit spreads will compress, putting more emphasis on credit performance, servicing reliability, and data transparency rather than sheer origination volume. Platforms that can demonstrate durability across credit cycles are likely to capture the next leg of institutional inflows.
Tokenised US Treasuries
Tokenised US Treasuries and money-market products expanded from $3.87B at the end of 2024 to $9.12B by late 2025, a 135.3% increase. The top ten assets grew from $3.82B to $8.04B over the same period, while their share of sector TVL declined from 98.6% to 88.2%. This points to two parallel trends: rapid growth in core products and a steady broadening of the issuer set.

Market leadership rotated as new regulated issuers entered. In 2024, Circle’s USYC dominated with 43.9% of the top ten. By 2025, its share had fallen to 12.9% as BlackRock’s BUIDL took the lead at 2.33B and 25.5% share.
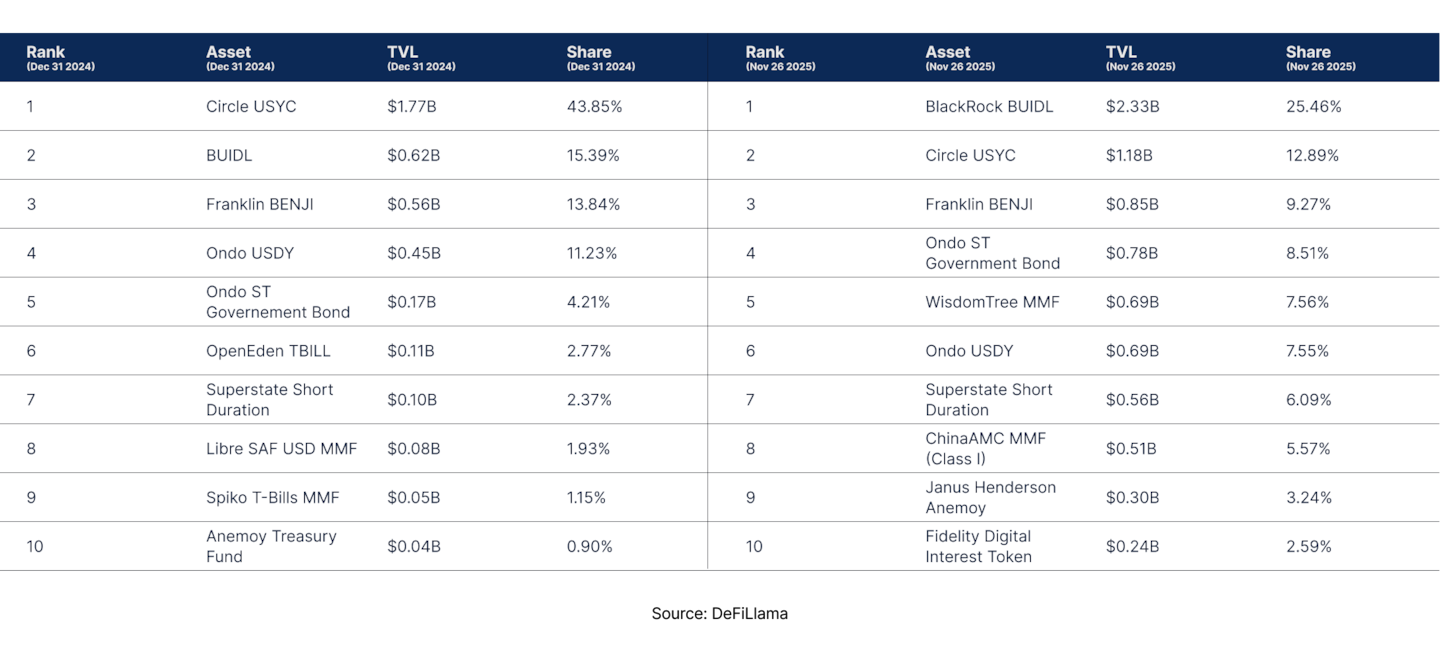
Franklin’s BENJI and Ondo’s USDY and short-term government bond fund together accounted for more than 17% of the top ten, while newly-scaled products from WisdomTree and Superstate, along with ChinaAMC, Janus Henderson’s Anemoy, and Fidelity’s Digital Interest Token, moved from effectively zero to over 2B in aggregate TVL.
Together, these shifts show a segment that is no longer limited by supply or controlled by any single company. Growth between 2024 and 2025 was driven by large asset managers tokenising existing cash and Treasury strategies, then distributing them through familiar institutional channels while also connecting them to onchain collateral markets.
Looking ahead, tokenised Treasuries are likely to remain the foundational base layer of RWA collateral, with 2026 flows driven less by headline APY and more by custody support, exchange and DeFi integrations, and the pace at which additional traditional managers bring their money-market products onchain.
Institutional Funds
Institutional fund RWAs grew from $0.17B to $2.77B over 2024 to 2025, with the top ten funds expanding from $0.17B to $2.56B and their share of segment TVL easing from 99.8% to 92.2%. The headline numbers are notable, but the more important change is the near-complete reshaping of the leaderboard.

In 2024, the top ten were led by early multi-strategy and venture-style products such as Superstate Crypto Carry, SPiCE VC, Cosimo X and Republic Note, all operating at sub $100M0.1B scale. By 2025, the largest position was Janus Henderson’s Anemoy AAA CLO Fund (JAAA), which went from zero to $1.01B and owning 36.0% market share of the top ten Funds.
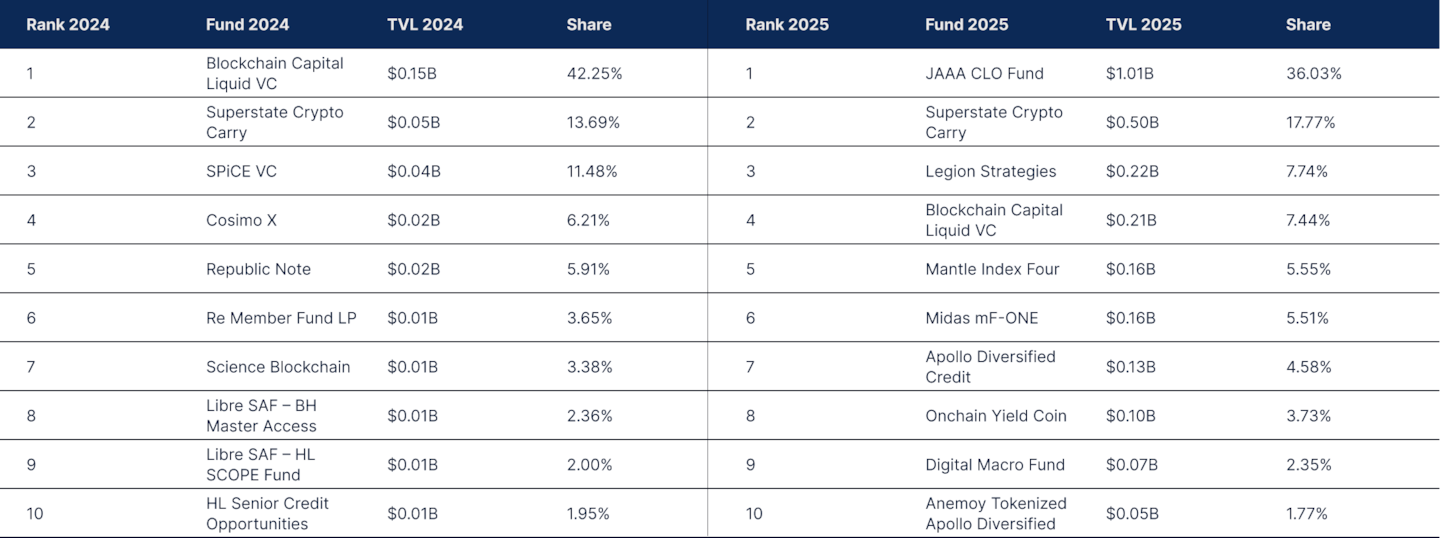
Superstate Crypto Carry grew from $0.05B to $0.50B but was joined by a new cohort of institutional vehicles, including Legion Strategies, Blockchain Capital’s liquid venture fund, Mantle Index Four and Midas mF ONE, each in the $0.15B to $0.22B range. Apollo Diversified Credit, Onchain Yield Coin, Digital Macro Fund and the Anemoy Tokenized Apollo Diversified fund rounded out a substantially larger and more diversified institutional set.
This evolution reflects a migration from experimental, equity-heavy RWA tokens toward tokenised versions of established credit, macro and liquid venture strategies managed by recognised firms.
Between 2024 and 2025, flows followed managers with existing track records, audited processes and clear legal wrappers, using tokenisation primarily as an operational and distribution upgrade. In 2026, institutional funds are likely to deepen rather than broaden, with growth driven by additional blue chip issuers bringing strategies onchain and by tighter integration of these vehicles into DAO treasuries, lending markets and onchain portfolio frameworks.
Yield Markets and Duration Trading
Yield remained one of the fastest-growing areas of DeFi over the past two years. Sector TVL increased from $3.77B at the end of 2023 to $8.21B at the end of 2024, then reached $8.71B by December 2, 2025. Growth slowed in 2025, but the structure of the market changed materially as duration trading matured and competition increased.
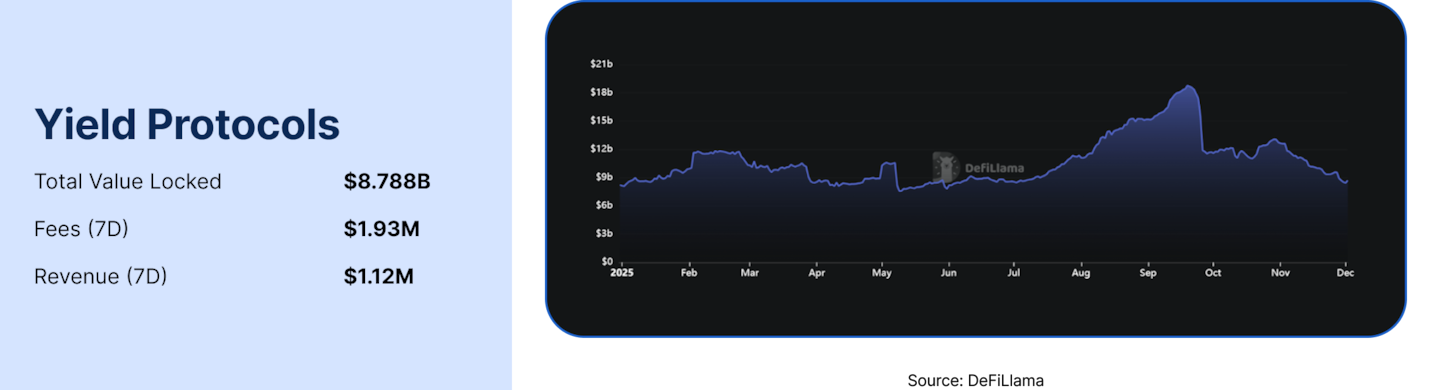
Market Share Shifts Among The Top Yield Protocols
Yield markets became more distributed in 2025 as new fixed-income platforms scaled and Pendle’s dominance eased. Pendle remained the largest venue, but its share of the top ten fell from 53.85% to 41.20% as liquidity rotated into newer structured-yield products. The most significant shift was the emergence of Spark Savings, which was absent from the 2024 leaderboard and entered directly into second place with 21.07% of sector TVL. Spark benefited from strong DAI-based flows and increased demand for simple, fixed-rate savings instruments.
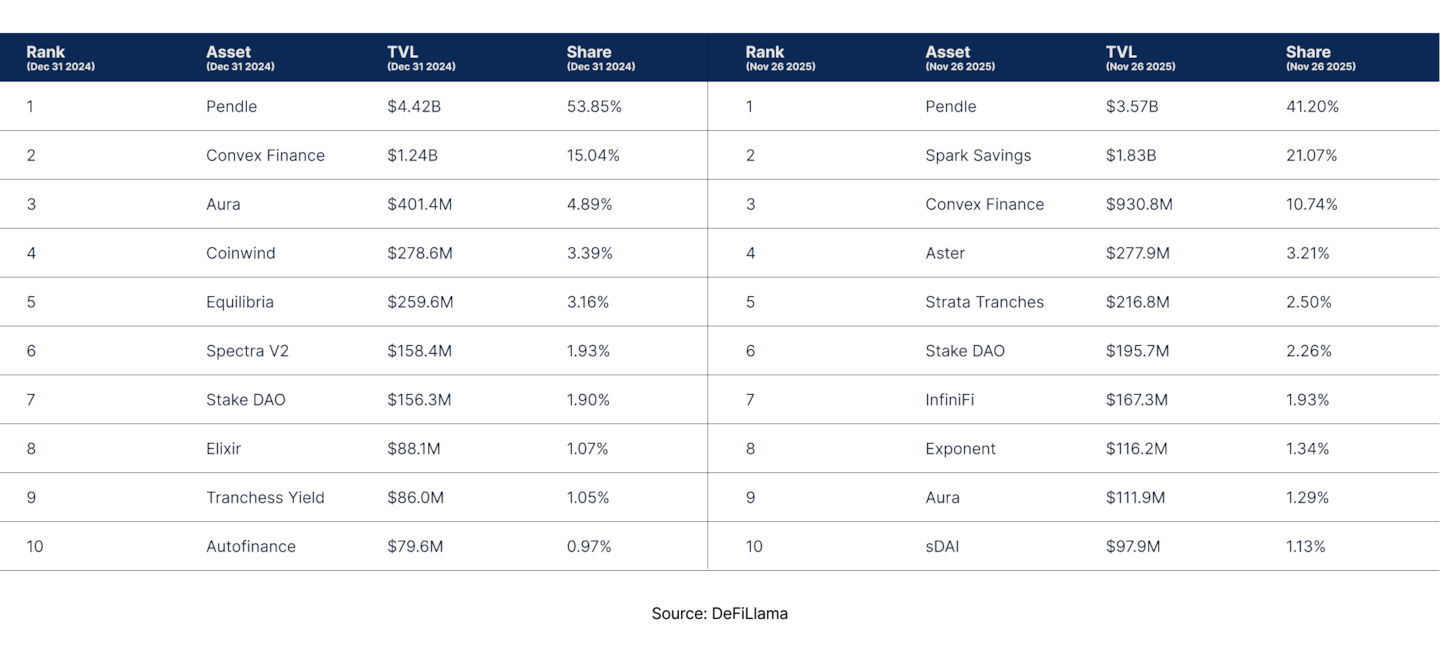
Convex Finance maintained a leading role but saw its relative position reshaped by the entrance of higher-growth competitors. Newer protocols such as Aster, Strata Tranches, InfiniFi and Exponent moved into the top tier and displaced earlier incumbents like Coinwind, Equilibria, Spectra V2 and Elixir. Their rise reflected growing user preference for structured stablecoin yields and more modular rate exposure.
Taken together, the sector evolved from a Pendle-centric market into a broader fixed-income ecosystem. Demand shifted toward platforms offering clearer duration profiles and easier treasury integration, while Pendle continued to anchor active rate trading through its PT and YT markets.
Collateral Structure and Duration Exposure
The more important change in 2025 was not how much capital sat in yield protocols, but what that capital was exposed to. Pendle’s collateral mix shifted from simple base assets to layered, structured stablecoins, even though underlying risk remained tightly linked to a small set of core issuers.

At the end of 2024, the platform was anchored almost entirely in USDe and blue-chip crypto assets. USDe alone represented nearly half of all collateral, with BTC and ETH wrappers making up most of the remainder. This mix reflected a yield landscape defined by simple stablecoin carry and straightforward basis trades, where traders monetised predictable funding spreads rather than engaging with more complex structured products. Assets such as USD0+++ captured additional deposits by offering boosted packaged yields, but the overall ecosystem remained narrow and dominated by first-generation instruments.
By late 2025, this structure had shifted decisively toward a multi-layered, stablecoin-centric market. The most significant change was the rise of Ethena-linked collateral. sSUSDE, the staked and reward-bearing form of USDe, became the largest individual asset on Pendle with 29.12% of collateral. Senior and tranche-based variants such as srUSDe added further demand for risk-segmented exposure, while USDe itself remained a major component at 11.54%. Including sUSDE, USDe, srUSDe and TUSDE, Ethena-related assets accounted for 48.72% of all collateral on Pendle, making Ethena the dominant foundation of the platform’s yield markets.
At the same time, the disappearance of USD0+++ and the decline of BTC/ETH wrappers highlight a broader consolidation around stable, predictable, and composable dollar-based yield sources. The growth of USDAI and SUSDAI shows that this trend now extends beyond Ethena to DAI-based structured products as well. Together, these shifts reflect the market’s preference for assets with tighter duration profiles, clearer funding mechanics, and more defensible yield generation, rather than volatile or multi-asset bundles that dominated in earlier cycles.
Viewed holistically, Pendle’s 2025 market shows a platform transitioning from a collateral pool driven by opportunistic carry trades to one dominated by stablecoin-native fixed income. The rise of staked, restaked, and tranched stable assets demonstrates that onchain participants increasingly seek predictable duration exposure and capital-efficient hedging tools. It also underscores the concentration risk forming around Ethena’s synthetic dollar ecosystem. With SUSDE and related tranches now representing a substantial share of Pendle’s total collateral, the protocol is more exposed than ever to the performance and stability of a single synthetic-yield infrastructure.
Yield Dynamics and Onchain Rate Curves
Yield markets continued to mature in 2025, with PT and YT instruments becoming core tools for treasuries, trading firms and structured-product protocols. Unlike lending or restaking, which offer relatively narrow risk–return profiles, yield protocols compensate users for both duration risk and liquidity risk, creating a clearer economic rationale for capital allocation.
Pendle remained the central venue for this activity. Its PT markets provided predictable fixed returns, while YT markets enabled leveraged exposure to funding rates and restaking-linked rewards. This dual structure allowed investors to tailor their risk rather than accept pooled outcomes, making yield markets one of the few segments where risk was consistently rewarded throughout 2025.
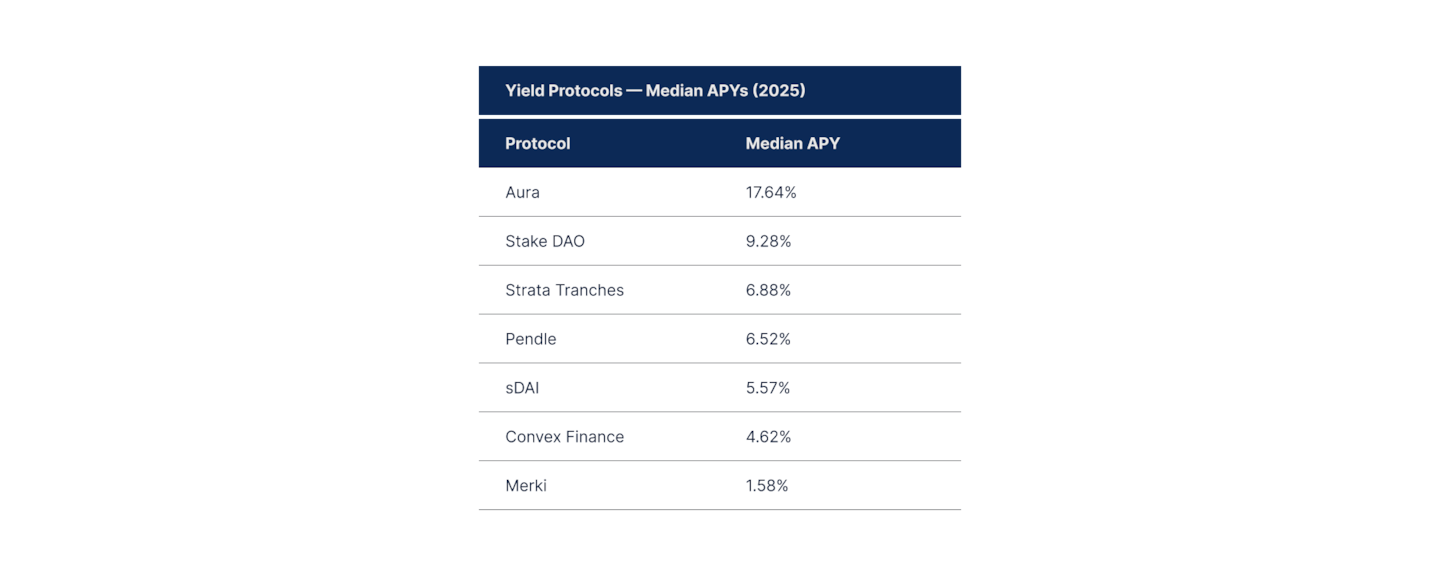
Across major platforms, yields cleared meaningfully above both lending rates and the compressed returns in restaking. While restaking often delivered 2–3% with additional operational and slashing exposure, Pendle’s market structure supported mid-single-digit to double-digit returns depending on tranche, maturity and underlying asset. This spread explains why capital continued to flow into yield protocols even as restaking unwound.
PT markets increasingly served as an onchain fixed-income layer, used to lock forward yields, while YT markets became the primary venue for expressing curve trades as restaking spreads, funding rates and stablecoin yields evolved. This dynamic pulled onchain rates closer to traditional money-market benchmarks and moved the sector away from incentive-driven growth toward genuine rate formation.
Liquidity Topography: Layer 1s, Layer 2s, And Bitcoin DeFi

Bitcoin now underpins both passive products and emerging DeFi ecosystems; what would you consider a credible path for Bitcoin to behave more like productive collateral and less like a static reserve asset?
The credible path starts with getting Bitcoin into programmable environments in a trust-minimised way and giving it roles beyond passive storage.
First, we need safer, more native representations of BTC as collateral. The closer the system stays to Bitcoin’s settlement assurances, whether through L2s, rollups, or covenant-aligned constructions, the more comfortable serious capital becomes using BTC as margin. That unlocks perps, options, credit lines, and Bitcoin backed stablecoins. At Hemi, this is exactly why we built hVM and are extending the model further: to enable truly native BTC representation and reduce reliance on opaque wrapping.
Second, BTC needs protocol-level jobs, not just collateral slots. It should be securing data availability, contributing to economic security, participating in insurance layers, or backing structured credit. This is the direction we’ve taken at Hemi: treating Bitcoin as an active component of system security and capital formation rather than a static reserve.
Third, the UX must align with Bitcoin’s culture. “Lock BTC on Bitcoin, mint usable collateral in one or two steps, and deploy it across DeFi” should be the norm, not five bridges and multiple trust points.
Ultimately, Bitcoin doesn’t stop being a reserve asset, it becomes the base layer of a broader collateral stack. Hemi’s role is to make that transition usable, composable, and aligned with Bitcoin’s guarantees.
When you look at the landscape of BTC oriented L2s, sidechains, and token wrappers, what features or guarantees do you see as non-negotiable if Bitcoin DeFi is to attract long-term capital rather than speculative flows only?
Three guarantees are essential:
1. Clear, minimized trust assumptions around BTC custody.
Institutions need to know who or what controls the asset and under what conditions. Ambiguous operator models won’t scale.
2. Predictable settlement and exit guarantees tied to Bitcoin.
Systems that can halt or censor withdrawals will never attract long-term collateral.
3. Preservation of Bitcoin’s principles: self-custody, verifiable state, permissionless access, all the while enabling capital efficiency.
The moment these are compromised, the asset stops behaving like Bitcoin.
This is precisely the design philosophy behind Hemi: a trust-minimised, verifiable execution environment that gives BTC productive utility while remaining aligned with Bitcoin’s settlement assurances.
As Bitcoin DeFi grows, do you expect it to evolve into an ecosystem with its own liquidity and narratives, or do you think its main impact will be to feed high-quality collateral back into Ethereum and other L2s?
Both dynamics will play out, but the gravitational center shifts toward Bitcoin as soon as BTC becomes productive collateral in a Bitcoin-aligned environment. There’s little reason forlong-horizon BTC to leave once the infrastructure is in place.
At the same time, Bitcoin DeFi won’t be isolated. It can export high-integrity collateral into Ethereum and other L2s, strengthening those systems with assets that carry Bitcoin’s assurances rather than synthetic representations.
Hemi is designed precisely for this dual role: enabling a native Bitcoin liquidity stack while cleanly interfacing with the rest of DeFi.
From a risk perspective, how should conservative BTC holders think about the step from custodial or ETF exposure into participation in BTC based DeFi, and what disclosures or tooling help them make that decision rationally?
Conservative holders should approach the shift the same way they evaluate any movement up the risk curve: by understanding control, conditions, and worst-case behavior.What they need are:
- explicit trust assumptions around custody and operators,
- predictable withdrawal guarantees,
- real-time monitoring of bridge health, proofs, and risk parameters,
- stress-scenario transparency showing how the system behaves during volatility or
- downtime.
They don’t need risk removed; they need it quantified. Hemi provides this through auditable trust boundaries and settlement behavior rooted in Bitcoin rather than in a custodian, giving conservative holders a way to participate without sacrificing their risk profile.
How do you see Bitcoin’s monetary properties, such as fixed supply, and its current holder base, shaping the types of DeFi applications most likely to succeed in a BTC native environment?
Bitcoin’s monetary profile rewards durability over experimentation. With a fixed supply and a long-horizon holder base, the successful applications will be those that respect scarcity and deliver predictable outcomes.
That means structured credit, term lending, conservative perps, real-yield vaults such as infrastructure, not reflexive incentives.
Execution layers like Hemi enable these applications to be built directly on top of Bitcoin’s settlement model, serving a user base that values stability, capital efficiency, and minimal dilution of Bitcoin’s monetary properties.
If more BTC begins interacting with DeFi, what second-order effects do you expect on stablecoins, collateral mixes in money markets, and cross-margin trading on other chains?
A meaningful increase in BTC participation would reshape collateral quality across the ecosystem.
Stablecoins could shift toward Bitcoin backed reserves or blended reserve structures that reduce reliance on a single collateral type. Money markets would incorporate BTC alongside stables and ETH as foundational collateral, improving credit tiers and lowering portfolio risk.For derivatives and cross-margin systems, productive BTC unlocks tighter spreads, deeper liquidity, and stronger cross-collateral frameworks. Once BTC enters the collateral stack, systems must handle its liquidity and tail behavior seriously, effectively raising standards across all chains.
Hemi provides the natural environment for this shift: Bitcoin-aligned collateral that remains composable enough to power downstream ecosystems.
Liquidity Topography: Layer 1s, Layer 2s, And Bitcoin DeFi
This section maps the evolving liquidity landscape across Layer 1s, Layer 2s, and Bitcoin DeFi, tracing how capital formation, trading activity, and monetary assets were redistributed between 2024 and 2025. By examining lending, perpetuals, spot DEX volume, and stablecoin supply across major ecosystems, it highlights where liquidity has become more productive, where execution has centralised into specialised environments, and where general-purpose chains have gained or lost structural relevance.
Chain and Sector Dynamics
Lending / Borrowing
Lending and money markets remained one of the most important sectors across chains, with both TVL and fees rising on the largest ecosystems. Ethereum, Solana, Arbitrum, and Base all generated higher lending fees from 2024 to 2025, even in cases where their TVL share stayed flat, showing that deposited capital became more productive.
Base is the clearest example of this shift. Lending TVL grew from about $1.0B to $3.1B, its share of chain TVL nearly doubled, and fees jumped from $13.5M to $69.5M. Meanwhile, smaller or more experimental chains like Polygon and Aptos saw lending TVL shrink, but fee generation per dollar of capital often increased as passive liquidity exited and only consistent borrowers remained.
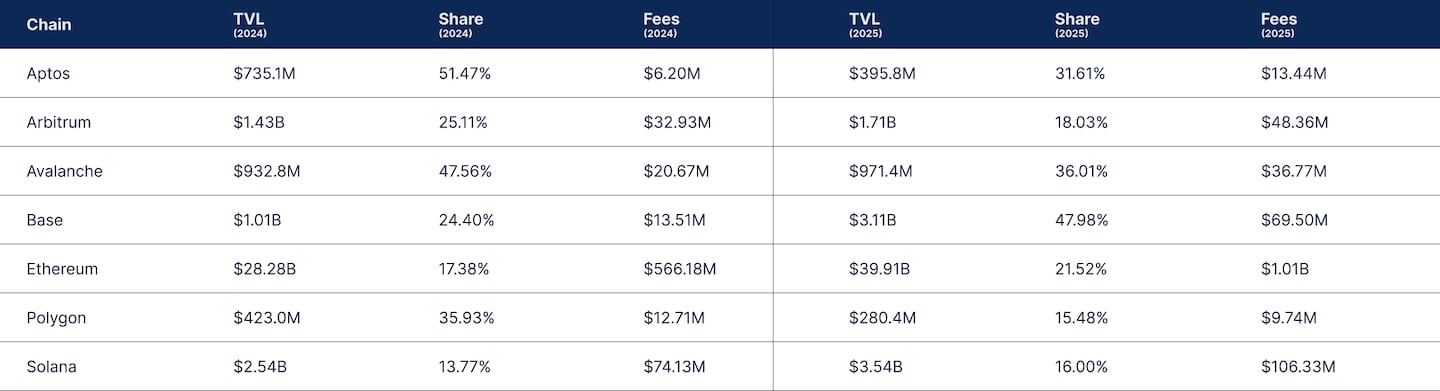
The percentage shifts show a clear consolidation of lending into a few structurally stronger ecosystems. Base and Ethereum gained lending share, while Aptos, Polygon, and Avalanche all saw meaningful declines, even where absolute TVL was relatively stable. This indicates that lending is becoming less evenly distributed across chains and more concentrated where sustained borrowing demand exists. In 2025, lending share increasingly reflects where leverage is structurally used, not where incentives temporarily attract deposits.
Arbitrum and Avalanche sit in the middle of this transition. Both grew lending TVL, but lost lending share as other sectors expanded faster, signaling diversification rather than lending-led growth. Solana stands out as the only chain where both lending TVL and share increased alongside rising trading activity, showing that credit growth there is being pulled by real trading demand rather than pushed by passive liquidity.
Perpetuals (perps)
Perps underwent the most significant structural shift of any DeFi vertical in 2025. In 2024, trading volume was still widely distributed across general-purpose chains. Ethereum ($410B), Arbitrum ($309B), Solana ($250B), dYdX ($242B), and Blast ($203B) all captured meaningful flow, while Hyperliquid led at $565B.
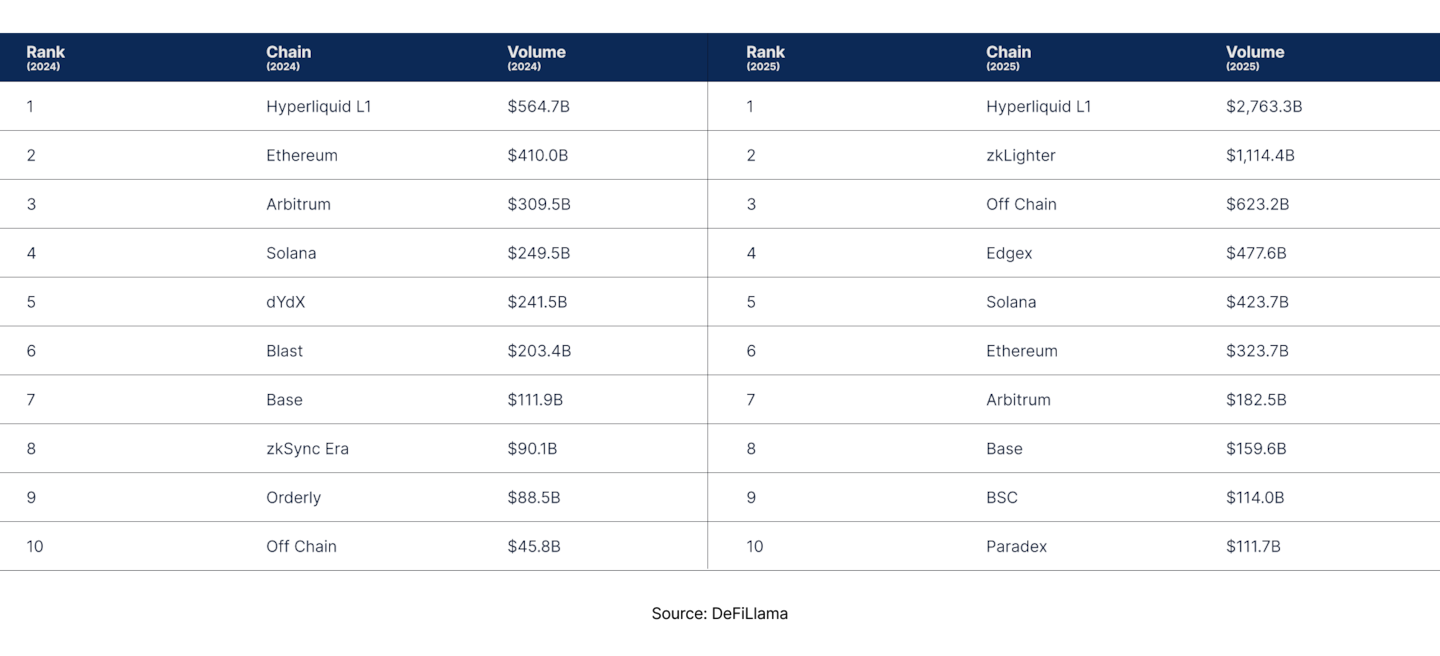
By 2025, perps volume had compressed sharply into a small set of purpose-built execution environments. Hyperliquid expanded more than fourfold to $2.76 trillion in volume, zkLighter reached $1.11 trillion, and the offchain execution category, which aggregates venues such as Aster, Vest Markets, Defx, and Upscale, collectively processed $623 billion. These venues match trades and maintain order state offchain, posting only settlement or risk checkpoints onchain, which makes them operationally closer to centralized exchanges than to traditional onchain perpetual DEXs. Edgex ($478 billion) and Paradex ($112 billion) also entered the top 10 as several legacy venues slipped in relative standing.
This redistribution shows that competition in perps has shifted from chains to execution quality. Volume is now concentrated on venues offering the lowest latency and most predictable fills. Ethereum and Arbitrum lost share as traders moved away from fee volatility and fragmented Layer 2 liquidity. Solana was the only general-purpose chain to remain a top-five venue in 2025 with $424B in volume, supported by its high throughput, low fees, and single shared state.
The ascent of zkLighter, Edgex, Paradex, and the offchain venues confirms a broader shift away from legacy chain-based perps toward vertically integrated execution stacks. Their growth was driven by a combination of low-latency infrastructure, tightly controlled risk engines, and points-based incentive programs that temporarily reduced effective trading costs. Their gains came largely at the expense of incentive-driven ecosystems like Blast and slower-moving venues such as dYdX.
Looking ahead to 2026, this structure is likely to persist. Perps liquidity is set to remain concentrated among a few execution-first venues, with competition focused on fee compression, capital efficiency, and cross-venue margining rather than chain distribution. Incentives will continue to influence short-term migration, but sustained leadership will depend on execution performance and risk management at scale.
Spot DEX Volume
Spot DEX activity remained more evenly distributed across chains than perps volume in 2024 and 2025, but the underlying market structure continues to converge toward a few dominant execution environments. Liquidity increasingly concentrates on chains that combine predictable execution, deep liquidity pools, and high uptime. Solana and Ethereum continue to anchor the top of the market by a wide margin.
However, Solana’s spot DEX volume more than doubled year-over-year from $693.6 billion in 2024 to $1.47 trillion in 2025, expanding its lead over Ethereum. This shift reflects a broader structural change in the DEX stack. Solana is no longer positioning itself as an alternative EVM environment. It is the first chain where onchain spot trading consistently exhibits liquidity conditions that approach those of centralised exchanges for both retail traders and automated strategies.

Several mid-tier chains posted breakout growth in 2025. BNB Chain’s spot DEX volume rose from $262.4 billion to $670.8 billion, while Base increased from $196.7 billion to $381.2 billion, reflecting continued strength as retail-heavy, CEX-adjacent trading venues. Sui also entered the top tier, tripling volume from $42.9 billion to $136.9 billion and ranking seventh overall, making it the only new execution environment to achieve sustained material spot liquidity in 2025.
In contrast, performance among general-purpose rollups was mixed to declining. Arbitrum slipped from $253.4 billion to $239.6 billion, while Polygon remained largely flat at $53.7 billion. Hyperliquid Layer 1 reached $160.6 billion in spot volume in its first full year of activity, surpassing both Arbitrum and Sui at launch and signaling accelerating convergence between spot and perpetuals-native infrastructure.
Stablecoins
Stablecoin supply remains the clearest proxy for persistent economic activity in DeFi, but the distribution across chains reflects two distinct usage patterns. Ethereum continues to function as the primary DeFi-native monetary layer. Its average stablecoin supply rose from $82.5 billion in 2024 to $135.6 billion in 2025, reinforcing its role as the dominant venue for onchain settlement, collateralisation, and stablecoin-based financial activity.
Tron, while second in absolute supply at $73.5 billion in 2025, represents a structurally different use case. The majority of Tron’s stablecoin balances are driven by centralised exchange settlement, offshore payments, and custodial flows rather than onchain DeFi activity. As a result, its growth reflects expansion in centralized stablecoin circulation more than growth in decentralized financial usage.
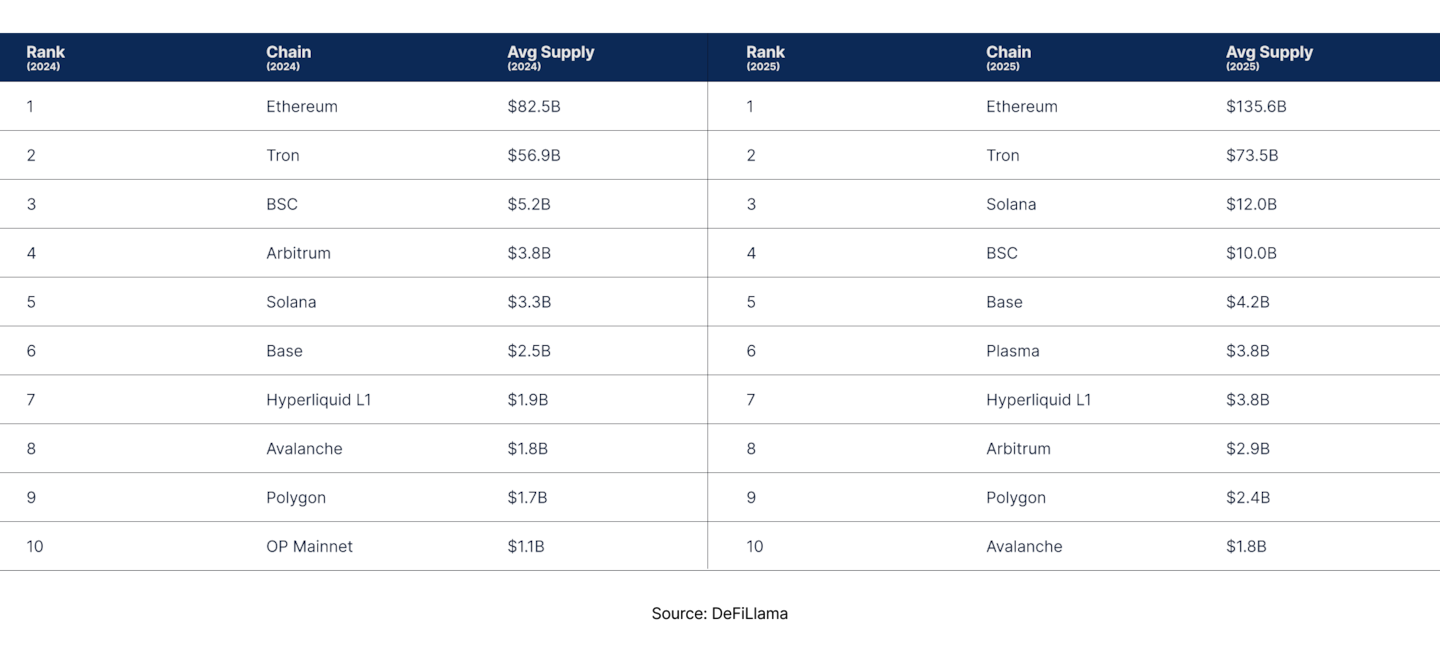
Among DeFi-native networks, Solana recorded the fastest expansion in stablecoin supply. Average balances increased from $3.3 billion in 2024 to $12.0 billion in 2025, a 263% gain that lifted Solana from fifth to third place. BNB Chain also saw a significant increase from $5.2 billion to $10.0 billion, while Base grew more modestly from $2.5 billion to $4.2 billion. Together, these three chains accounted for the majority of incremental DeFi-native stablecoin growth outside of Ethereum in 2025.
New execution-focused entrants continued to reach meaningful scale. Hyperliquid Layer 1 nearly doubled its stablecoin supply from $1.9 billion to $3.8 billion, while Plasma entered the top ten shortly after its September launch with $3.8 billion in average balances.
In contrast, Arbitrum declined from $3.8 billion to $2.9 billion, OP Mainnet exited the top ten, and both Polygon and Avalanche posted only incremental increases. Stablecoin growth is increasingly concentrated on chains with high throughput and active trading demand rather than on general-purpose rollups.
If these trends persist, stablecoin liquidity in 2026 is likely to become even more top-heavy, with incremental dollar liquidity accruing primarily to Ethereum for capital-intensive DeFi and to a small set of high-performance execution layers such as Solana, BNB Chain, and emerging trading-focused Layer 1s.
Solana’s High-Throughput Trading Ecosystem
Between 2024 and 2025, Solana shifted from being a general-purpose smart contract chain to a chain primarily optimised for trading. Activity concentrated around token issuance platforms, high-throughput DEXs, fast perpetual futures venues, and a growing lending layer that supports leverage and liquidity. Together, these components turned Solana into a single, integrated environment for high-volume onchain trading.
Base Layer Scale and Revenue Dominance
Between 2024 and 2025, Solana saw a large increase in base network activity and monetisation alongside a pullback in peak retail usage. Total transactions rose from 13.16 billion to 21.01 billion, a 59.6% increase, confirming sustained growth in everyday onchain activity. At the same time, peak daily users fell from 8.81 million to 6.34 million, a 28.0% decline, showing that 2024 was driven by extreme retail spikes, while 2025 reflected fewer but economically stronger users.
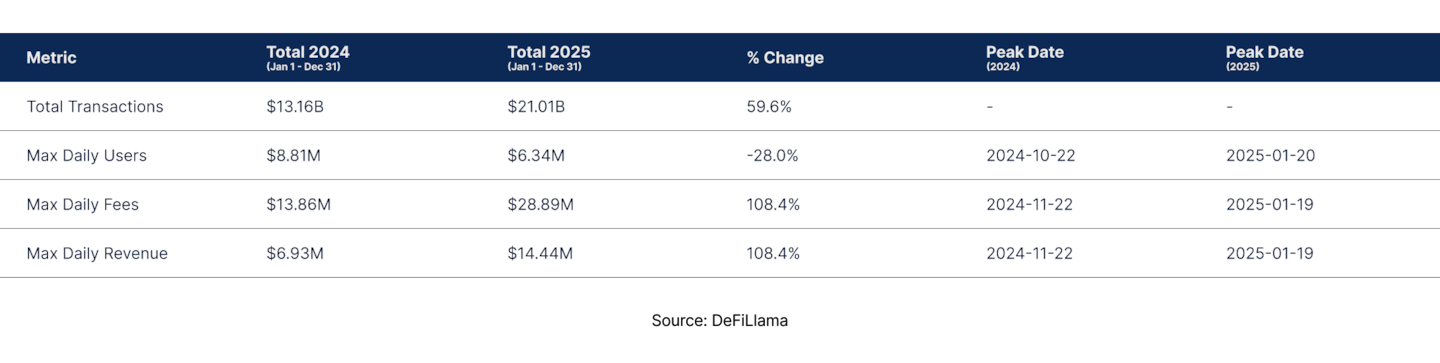
This shift is reinforced by the network’s monetisation. Peak daily fees and peak daily revenue more than doubled year over year, rising to $28.89 million and $14.44 million in early 2025. The timing of these peaks aligns with the most intense token issuance and perpetual trading cycles of the year, when Solana became the primary venue for speculative flow across DeFi. Looking ahead, this combination of higher transaction throughput, stronger fee capture, and lower reliance on retail user spikes positions Solana as a structurally important trading and settlement layer going into 2026, rather than a chain driven mainly by episodic speculation.
Solana’s share of total DeFi TVL also increased in 2025 and, more importantly, became structurally more stable. Its average share rose from 5.08% in 2024 to 7.73% in 2025, while peak share increased from 8.33% to 9.82%. This confirms that Solana captured a larger portion of DeFi activity on a sustained basis rather than only during brief speculative surges.

The most important change is in the minimum share. In 2024, Solana’s market share fell as low as 2.33% during inactive periods. In 2025, the minimum rose sharply to 6.60%, showing that Solana no longer relies on episodic spikes to maintain relevance. Instead, it now holds a consistently higher baseline of DeFi activity, positioning it as a structurally important execution and liquidity layer heading into 2026.
Contribution of Solana Protocols to Global DeFi
Solana’s current market share in 2025 shows a clear imbalance between trading-heavy sectors and credit. In DEXs, Solana holds 16.97% of global TVL, nearly matching its 16.95% share in liquid staking, which confirms that trading and staking are the two areas where Solana already operates at a global scale. These two sectors also reinforce each other mechanically, as staked SOL and liquid staking tokens are actively used as collateral, LP assets, and trading inventory across the ecosystem.

By contrast, Solana’s 5.59% share of global lending TVL highlights that its credit layer remains structurally smaller than its trading layer. This gap explains why Solana’s ecosystem is still dominated by spot and derivatives flow rather than balance-sheet driven activity. The difference also clarifies what changed in 2025: trading and staking scaled faster than secured credit.
If lending protocols such as Kamino, MarginFi, and Jupiter Lend continue to grow into 2026, the key question is whether lending begins to converge toward Solana’s much larger trading footprint, or whether Solana remains structurally skewed toward high-velocity markets rather than deep credit formation.
DEX Dominance and the Spot Trading Engine
Solana’s spot DEX dominance rose structurally across 2024 and peaked in early 2025 before settling into a higher long-term range. Through most of 2024, Solana’s share of global DEX volume fluctuated between roughly 15% and 30%, with brief drawdowns during quieter market periods. In early 2025, dominance spiked sharply, briefly exceeding 70% during the height of issuance and meme-driven trading activity. That peak marked the moment when Solana became the primary venue for onchain price discovery.
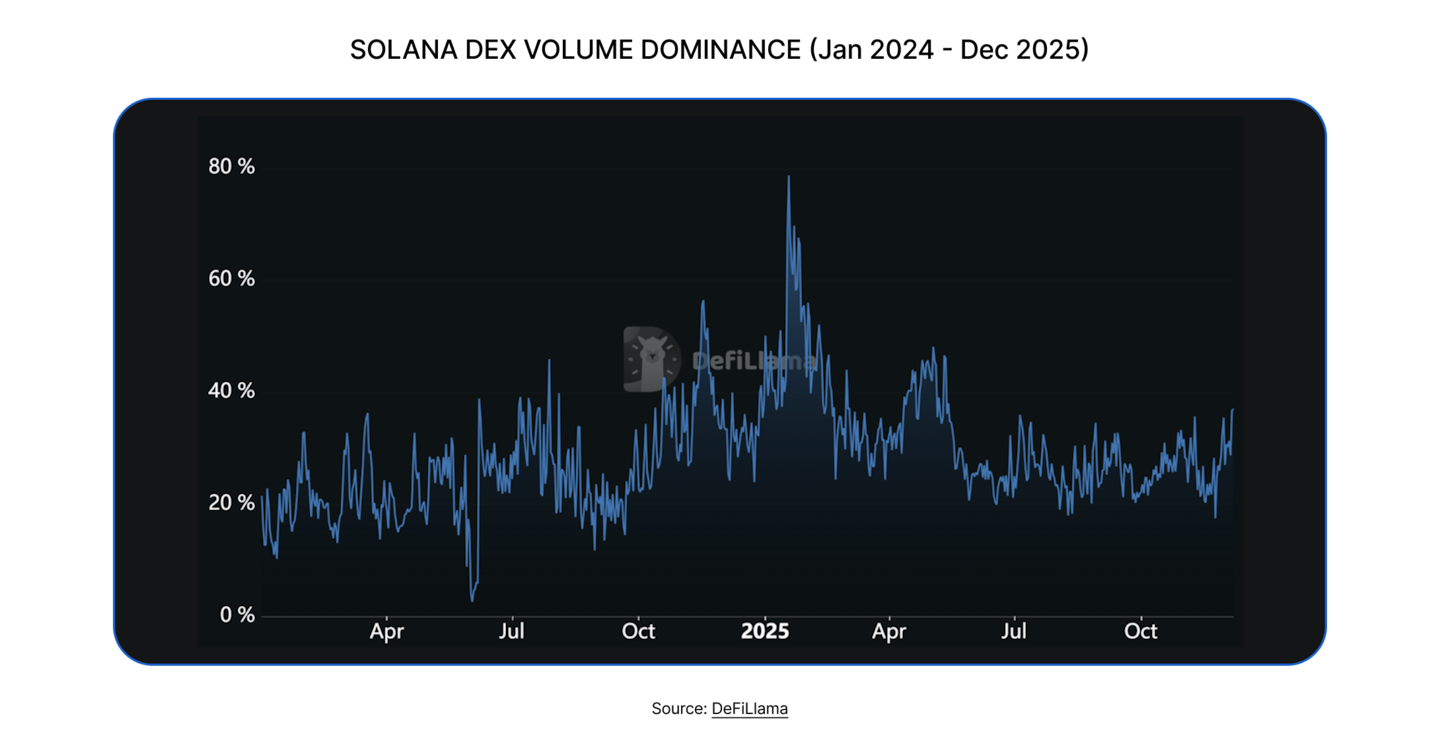
After the early-2025 blow-off, Solana’s DEX dominance compressed but did not revert to prior lows. Through the second half of 2025, Solana consistently held roughly 20% to 35% of global DEX volume, indicating that a larger baseline of spot trading activity remained embedded onchain even as speculative intensity cooled. This confirms that Solana’s spot market leadership is no longer purely cyclical. Going into 2026, the data supports a regime where Solana operates as a structurally dominant retail and high-frequency spot venue, rather than a temporary liquidity magnet during issuance cycles.
Perpetuals and High-Frequency Risk Markets
Solana’s perpetual volume dominance followed a far more volatile path than spot DEXs, reflecting the cyclical nature of leveraged trading. In 2024, Solana’s share of global perp volume oscillated between low single digits and the low-teens, with frequent sharp spikes tied to specific volatility clusters. These spikes became more pronounced in late 2024, as Solana-native perp venues absorbed increasing leverage linked to spot issuance.
Dominance reached its most unstable phase in early 2025, with repeated bursts above 20% and occasional spikes approaching 30%, followed by rapid reversals. As 2025 progressed, Solana’s perp dominance trended lower and stabilized in the mid-single-digit range, reflecting growing competition from perps-native execution venues and offchain matching stacks. Unlike spot trading, Solana did not retain structural control of the derivatives stack. Heading into 2026, the chart implies that Solana will remain an important volatility venue during risk-on periods, but derivatives leadership is likely to remain fragmented and execution-driven rather than chain-anchored.
Lending Dominance and the Capital Base
Solana’s share of global lending TVL rose steadily through 2024, peaking around the 6% to 7% range in late 2024 and early 2025. This climb coincided with the rapid expansion of Solana’s trading ecosystem, as leverage demand spilled over into native money markets. For the first time, Solana briefly operated with a lending footprint approaching that of its trading footprint in relative terms.
In 2025, lending dominance retraced and stabilized closer to the 4% to 5% range, where it remained relatively stable for most of the year. Unlike spot and perps, lending did not experience extreme dominance spikes. Instead, it exhibited slower but more persistent convergence toward a higher baseline than in early 2024. This confirms that while Solana’s credit layer is still smaller than its trading engine, it is becoming a structurally permanent part of the ecosystem rather than a purely speculative appendage. Going into 2026, the lending dominance trend suggests incremental deepening of Solana’s capital base rather than explosive growth, with credit increasingly anchored to real trading demand rather than incentive-driven TVL.
Ethereum and the Layer 2 Economy
This section examines the Layer-2 landscape through the lenses of Total Value Secured (TVS) and Data Availability (DA), two metrics that together capture both where economic value is settling and how execution is being underwritten. While 2024 was characterised by heavy concentration among a small number of general-purpose rollups, 2025 marked a clear structural inflexion as value began dispersing across a wider set of specialised execution layers.
Total Value Secured (TVS)
In 2024, the Layer 2 TVS landscape was defined by extreme concentration among general-purpose rollups. Arbitrum, Base, and Optimism formed a dominant core, collectively securing the vast majority of economic value, with Arbitrum and Base alone accounting for over $33 billion in TVS.
At this stage of the cycle, security demand largely followed liquidity and composability, reinforcing a winner-take-most dynamic among the largest execution layers. Subscale rollups such as Starknet, Linea, zkSync Era, and Scroll remained structurally secondary, reflecting infrastructure build-out rather than mature capital aggregation.
By 2025, the market had entered a new phase characterised by compression at the core and expansion at the edge. While Arbitrum and Base retained systemic leadership, both saw modest absolute declines in TVS, and Optimism experienced a sharp contraction as value migrated downstream into OP-stack execution environments. More notably, a new class of application-specific chains emerged directly into the top tier: Lighter, Katana, Ink, and Unichain scaled from negligible or nonexistent bases into capital-material networks.
This transition signals a structural reallocation of security from generalised execution toward vertically optimised environments for trading, liquidity, and high-intensity financial workloads. The Layer 2 market is now moving beyond a land-grab phase and into one where economic throughput, not just composability, determines where value is ultimately secured.
Entering 2026, the Layer 2 TVS market is likely to remain barrelled. Arbitrum and Base should continue to anchor systemic secured value, while incremental growth accrues to application- and sector-specific execution layers optimised for perps, payments, and liquidity. Following the Base and Ink model, more exchanges, fintechs, and payment providers are likely to launch proprietary Layer 2s, making the next phase of Layer 2 expansion driven by vertical specialisation rather than general-purpose scale.
Data Availability Market
The data availability (DA) market for Ethereum-scaling systems has undergone a meaningful structural transition over the last twelve months. In 2024, Ethereum was the dominant DA provider by an overwhelming margin, with most rollups publishing transaction data either as calldata or, following EIP-4844, as blobs. Alternative DA layers existed, but their usage was limited to early modular experiments and carried little economic weight.
By 2025, the market has shifted to a multi-provider structure, with five primary DA layers now securing meaningful economic value: Ethereum, EigenDA, Celestia, Avail, and Espresso DA. Despite this diversification, Ethereum remains the systemic core of the DA market, securing an order of magnitude more value than all competitors combined.
From a bytes-posted perspective, the progression can be summarised in three phases. In early 2024, Ethereum accounted for nearly all DA usage. In the second half of 2024, Celestia captured a large share of marginal DA demand as modular rollups such as Eclipse and Manta Pacific scaled. In 2025, Ethereum regained the dominant share of total data posted, while EigenDA emerged as a third major contributor alongside Celestia.
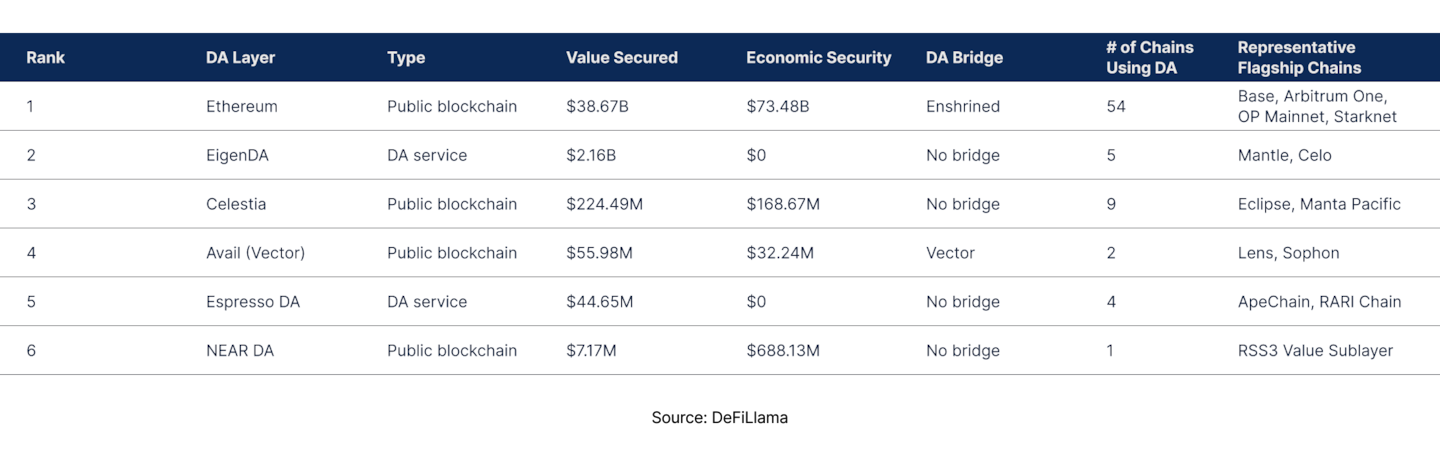
Celestia’s market share increased materially in 2024 as several high-throughput modular rollups, most notably Eclipse and Manta Pacific, selected Celestia to optimize for data cost efficiency and execution bandwidth, resulting in a rapid expansion of non-Ethereum DA usage. Its subsequent moderation in relative share during 2025 reflects the significantly faster growth of Ethereum blob usage, driven primarily by Base and the broader OP Stack ecosystem, rather than a contraction in Celestia’s own activity.
In parallel, EigenDA emerged as an additional sink for modular DA demand following Mantle’s migration, which distributed non-Ethereum data flows across a broader provider set. As rollup TVL increased, security preferences also shifted incrementally toward Ethereum’s fully enshrined DA model for higher-value workloads, while the stabilisation of blob pricing reduced cost-driven incentives for DA migration.
The DA market entering 2026 is best characterised as structurally multi-polar but economically hierarchical. Ethereum is likely to retain dominance in value-weighted DA due to its unmatched economic security and institutional trust profile. EigenDA and Celestia are positioned to absorb a growing share of bandwidth-intensive, cost-sensitive workloads, particularly from consumer, gaming, and emerging financial protocols. Avail and Espresso DA remain niche but viable, with concentration in specific vertical ecosystems.
A key implication is that no single DA provider is likely to displace Ethereum as the primary security anchor for high-value rollups by 2026. Instead, the market is converging toward a barbell structure in which Ethereum services the high-value settlement layer, while external DA providers service high-throughput and cost-optimised data workloads.
Bitcoin DeFi’s Emerging Architecture
Bitcoin DeFi expanded sharply between 2024 YTD and 2025 YTD in both USD and BTC terms. Total TVL rose from $9.88 billion to $26.83 billion, while the average BTC price increased from $62,028 to $110,642. When adjusted for price and expressed in BTC terms, TVL grew from 159,286 BTC to 242,501 BTC. This 52% increase in BTC-denominated TVL confirms that growth was driven by real increases in deployed Bitcoin rather than by price appreciation alone.
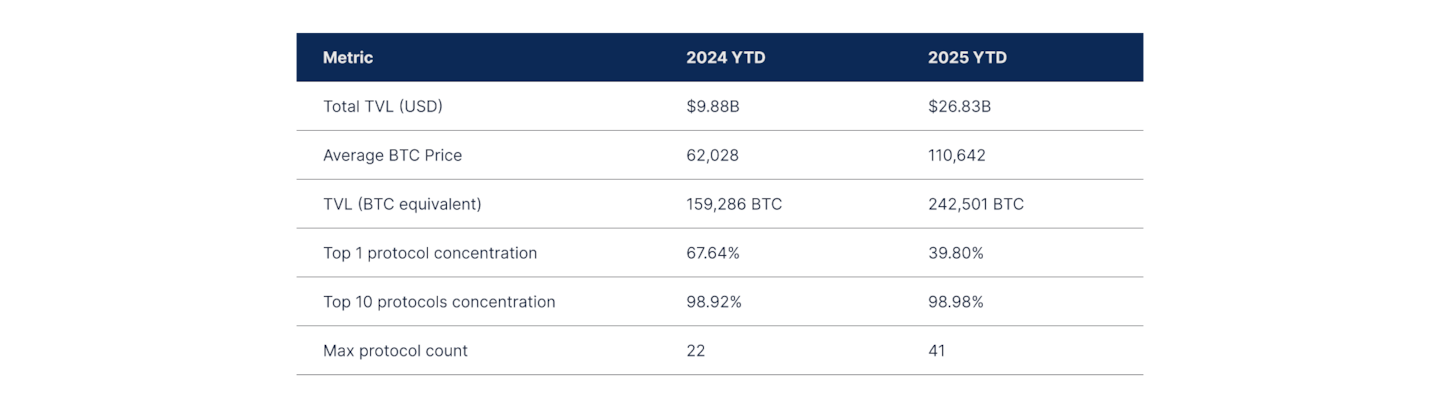
Despite this rapid expansion, the market remains highly concentrated. In 2024, the largest protocol controlled 67.64% of all Bitcoin DeFi TVL. By 2025, that share declined to 39.80%, signaling meaningful diversification at the top. However, concentration across the broader market remains extreme: the top ten protocols collectively held nearly the entire sector in both periods, increasing marginally from 98.92% to 98.98% of total TVL.
BTC-Oriented Layer 2s and Sidechains
BTC-oriented Layer 2s and sidechains played a visible but shrinking role in Bitcoin DeFi between 2024 and 2025. At the end of 2024, the largest BTC-aligned chain held $803.5M in TVL, with several others clustered between roughly $170M and $360M. By early December 2025, the ranking had reshuffled and nearly all of these chains had seen steep TVL declines.
CORE fell from $803.5M to $45.9M, a decline of over 94%, while Bitlayer dropped from $358.8M to just $6.4M, a loss of more than 98%. Even the leading BTC-aligned chain in 2025, Rootstock, held only $153.0M in TVL, down 30.51% year over year. Only a small number of networks, such as Rollux and Stacks, experienced relatively modest single-digit declines, while Botanix and Hemi appeared as new entrants at much smaller scales.
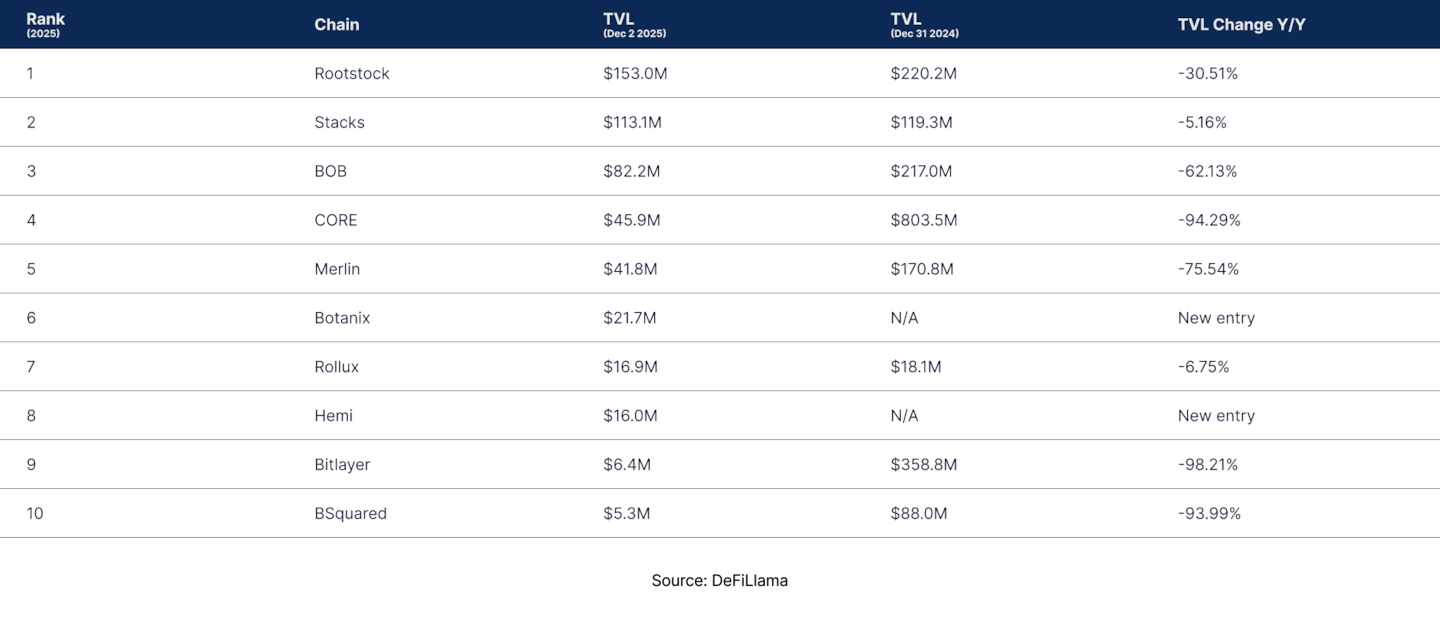
This divergence reflects a retention problem at the chain level rather than a lack of aggregate demand for Bitcoin DeFi. While BTC deployed into DeFi increased materially in 2025, most BTC-aligned Layer 2s and sidechains were not able to retain that capital on their own execution environments. Instead, BTC increasingly moved through these chains only as a transit layer before being deployed into higher-level products such as bridges, restaked BTC, and liquid BTC wrappers that are used across multiple ecosystems.
Looking into 2026, the data implies that BTC-aligned execution layers will likely remain a smaller share of total Bitcoin DeFi unless they can sustain repeat usage beyond initial deposits and migrations. In their current form, growth in Bitcoin DeFi continues to express primarily at the asset and wrapper layer rather than through persistent expansion of BTC-native application ecosystems.
Protocol composition and sector shifts
Liquidity within Bitcoin DeFi continued to consolidate around a small group of large bridging and wrapping protocols in 2025. WBTC remained the dominant asset, but its liquidity declined from $12.27B to $11.14B, indicating that Bitcoin DeFi growth did not accrue proportionally to legacy wrapped BTC. At the same time, exchange-backed bridges gained relative importance. Coinbase Bridge rose to $6.46B and Binance Bitcoin held $6.13B, placing both ahead of most decentralized alternatives. This reflects a clear user preference for deep liquidity, operational certainty, and seamless exchange integration during periods of rising onchain BTC deployment.
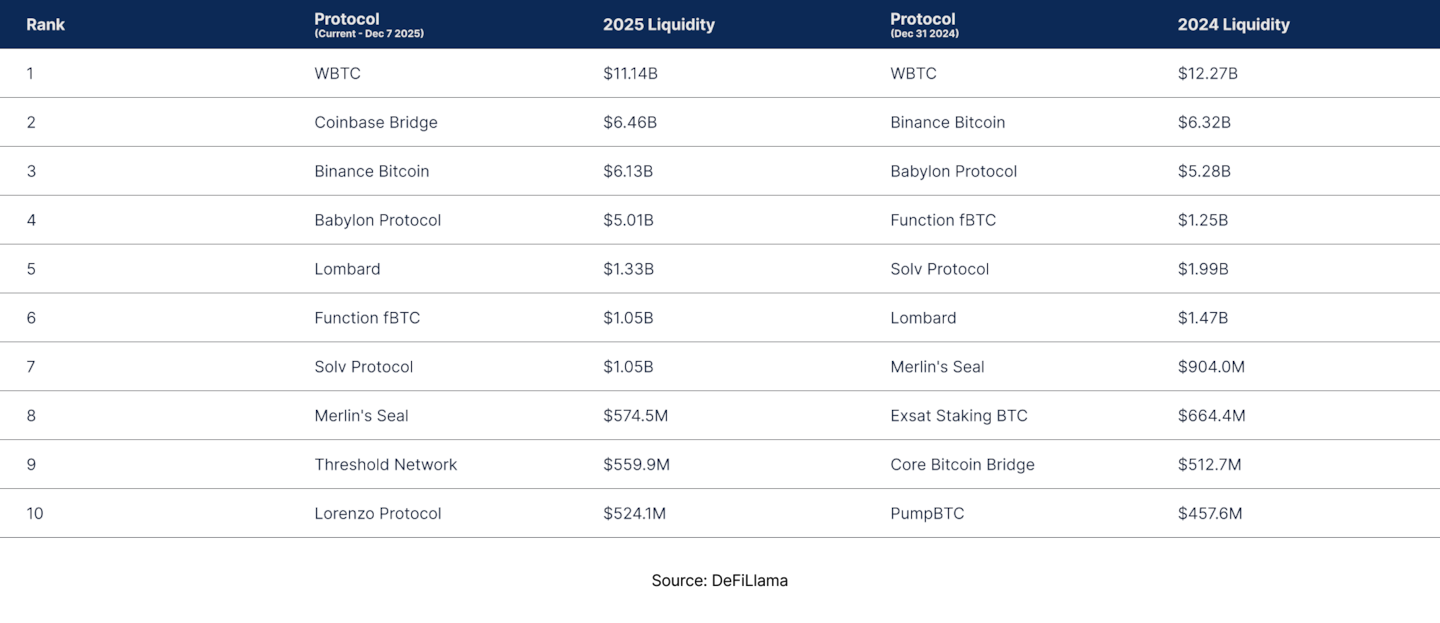
The most notable structural change was the rotation between restaking and wrapper protocols. Babylon declined modestly from $5.28B to $5.01B but remained a top-four protocol, confirming the durability of the BTC restaking narrative even after its initial growth phase. By contrast, some second-generation wrappers saw sharper reordering. Lombard declined from $1.47B to $1.33B, while Solv Protocol fell from $1.99B to $1.05B, signaling weakening momentum in smaller yield-driven BTC wrappers as capital concentrated into fewer, more liquid primitives.
Mid-tier protocols experienced the greatest compression. Merlin’s Seal dropped from $904M to $574.5M, while Core Bitcoin Bridge exited the top tier entirely. New entrants such as Threshold Network ($559.9M) and Lorenzo Protocol ($524.1M) replaced lower-liquidity legacy wrappers, indicating continued churn below the top five and a lack of durable moat among smaller BTC DeFi protocols. Overall, the top 10 remained tightly clustered, underscoring that Bitcoin DeFi still exhibits extreme protocol-level concentration despite rapid aggregate growth.
Looking into 2026, the data implies that Bitcoin DeFi growth is likely to continue accruing primarily to exchange-connected bridges and large restaking systems rather than to long-tail wrappers or application-specific protocols.
Hemi Activity and TVL Context in 2025
Although Hemi enters the BTC-aligned L2 rankings at a smaller scale using DeFiLlama’s TVL of approximately $16M, the picture looks different through Hemi’s own Dune dashboard, which shows roughly $330M in circulating wrapped BTC, ETH, and stablecoin balances on the network. The largest assets include mBTC and nBTC, each with around $87M in TVL, followed by bfBTC at approximately $61M.
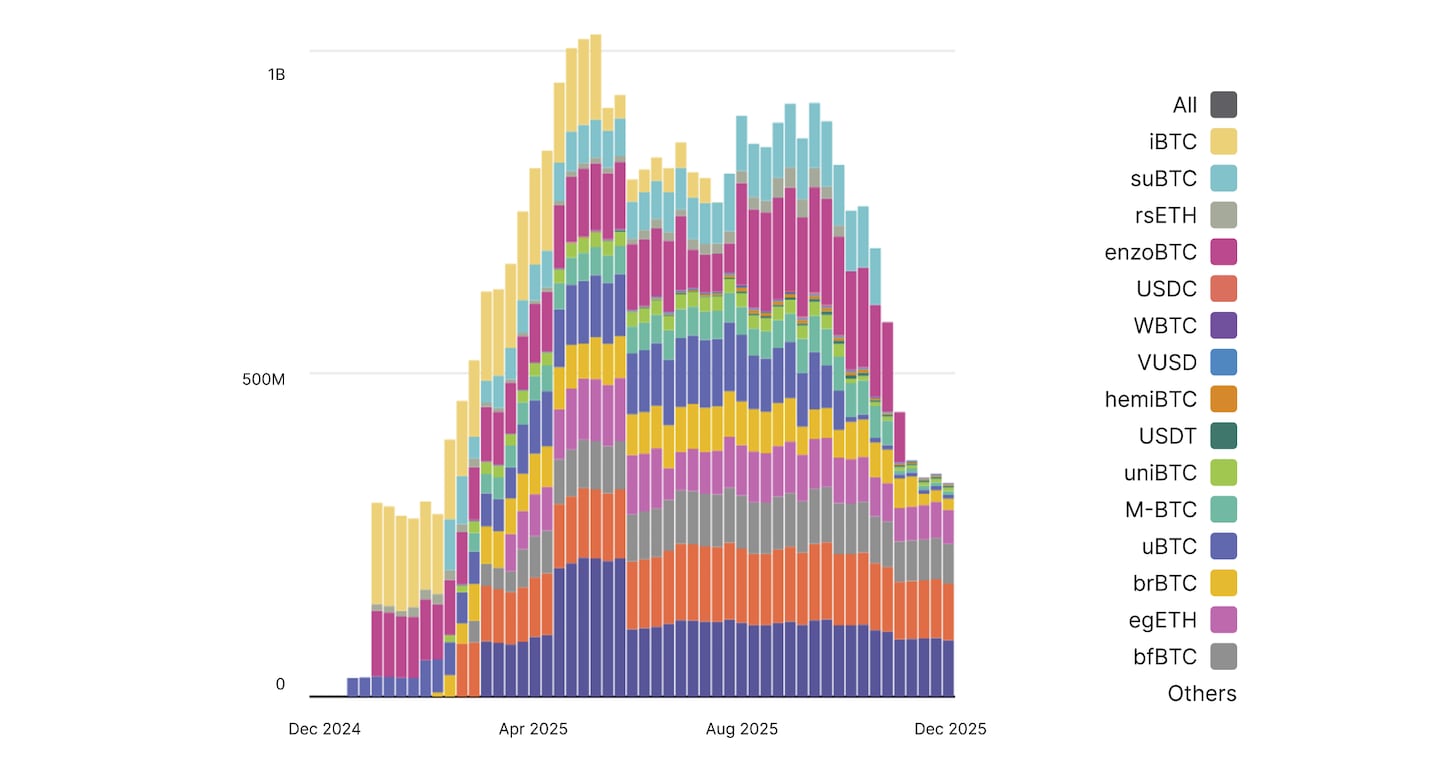
Activity on Hemi strengthened over the course of 2025. Weekly transaction volume accelerated sharply beginning in Q3, with several sustained periods above 500,000 transactions. Activity peaked during the week of October 27, reaching approximately 1.3 million transactions. By November, weekly transaction counts had moderated, ranging between roughly 113,000 and 126,000.
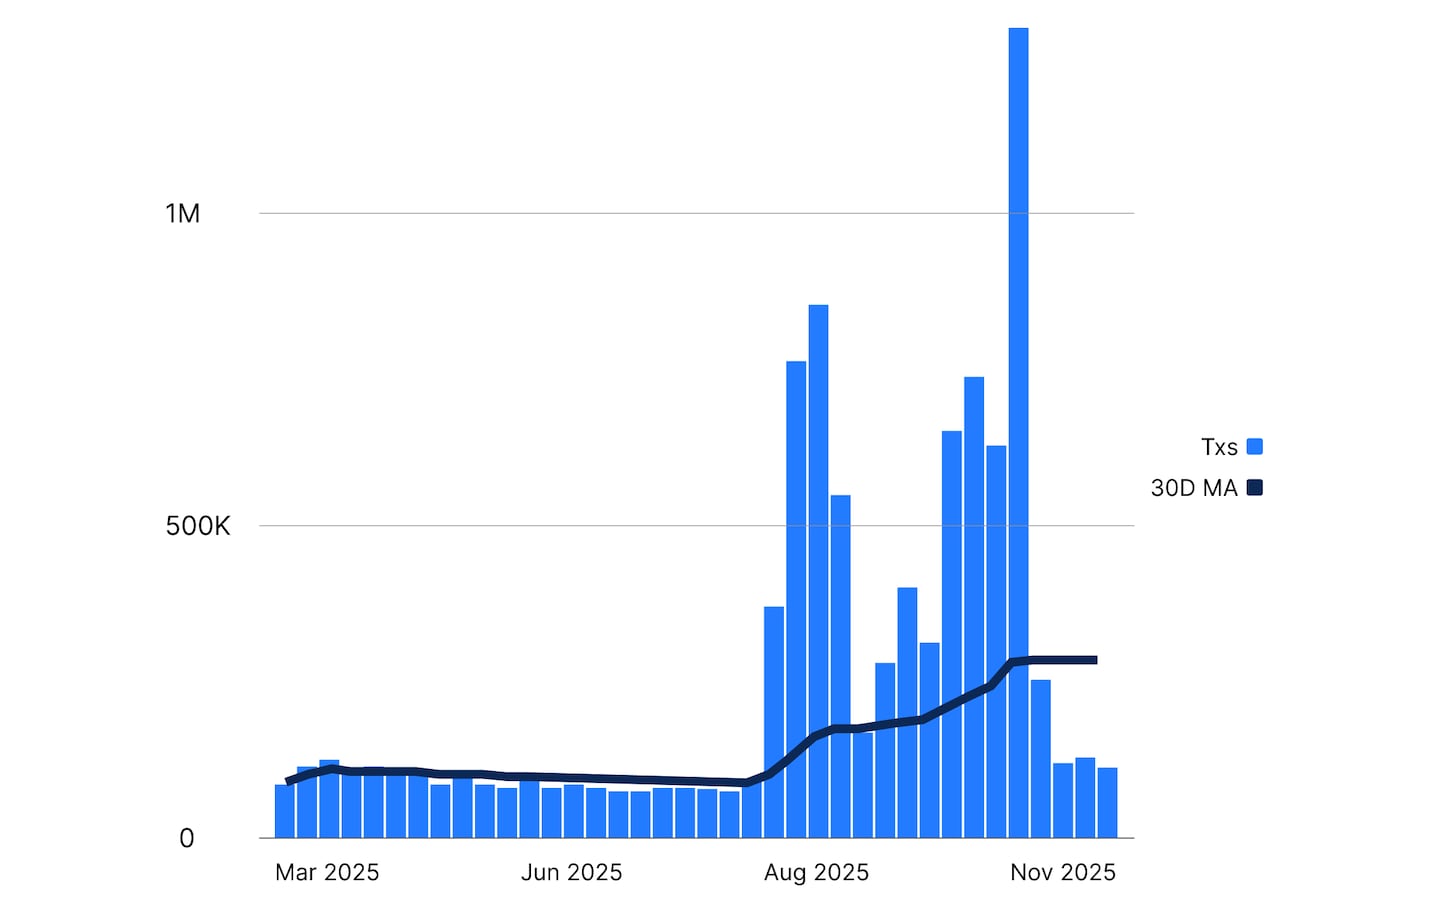
Part of this traction appears linked to Hemi’s tunneling system, which allows BTC and Ethereum assets to move onto the chain without relying on multisig bridge custody. The design provides protocol-level verification anchored to Bitcoin security, giving users a clearer path to deploy BTC into vaults, lending markets, and other yield strategies on Hemi.
Execution, MEV, Privacy, And Market Integrity
MEV Supply Chain
MEV has fully transitioned from an adversarial byproduct of public mempools into a formalised, institutional layer of block production. Across Ethereum and BNB Chain in particular, MEV is now primarily mediated through builders, private order-flow routing, and explicit auctions rather than open mempool competition. Compared to 2024, the defining change is not higher MEV activity, but greater infrastructure concentration and lower marginal value per block, alongside a partial reduction in user-visible toxic MEV on protected execution paths.
On Ethereum, MEV remains structurally important but economically compressed. On BNB Chain, MEV has been almost completely internalised into a permissioned builder market. Meanwhile, sandwich activity across Ethereum shows signs of long-run stabilisation rather than structural growth. Together, these trends suggest that MEV revenue is becoming more predictable for infrastructure operators while becoming less extractive on the margin for end-users.
Ethereum: Toxic MEV Stabilises, but Concentration Persists
Ethereum’s sandwich economy in 2025 shows clear signs of maturation rather than expansion. The weekly count of active sandwich bots remains elevated relative to early DeFi history but is meaningfully below its speculative-cycle peaks and far less explosive than in prior bull markets. After multiple surges between 2020 and 2023, bot counts in 2024–2025 flatten into a relatively stable band, indicating that sandwiching has consolidated into a smaller number of professional operators rather than a long tail of opportunistic bots.
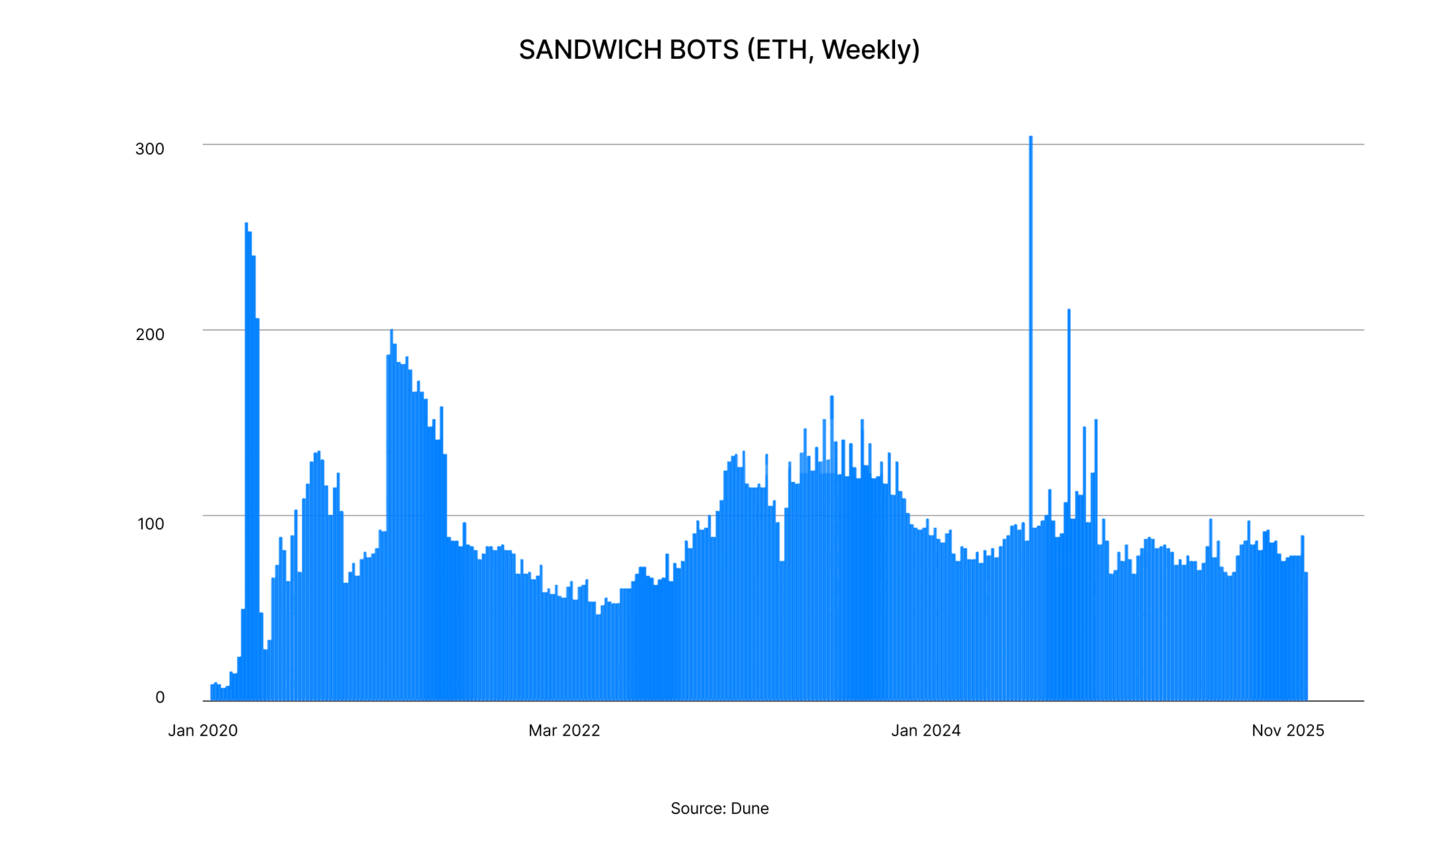
The distribution of sandwiched volume by protocol reinforces this consolidation. Uniswap remains the dominant venue for sandwich extraction through 2025, but its share declines as Curve, Maverick, Fluid, and long-tail AMMs capture a growing portion of exploitable volume. This reflects the broader fragmentation of onchain liquidity as capital disperses across multiple swap designs rather than concentrating exclusively on Uniswap pools.
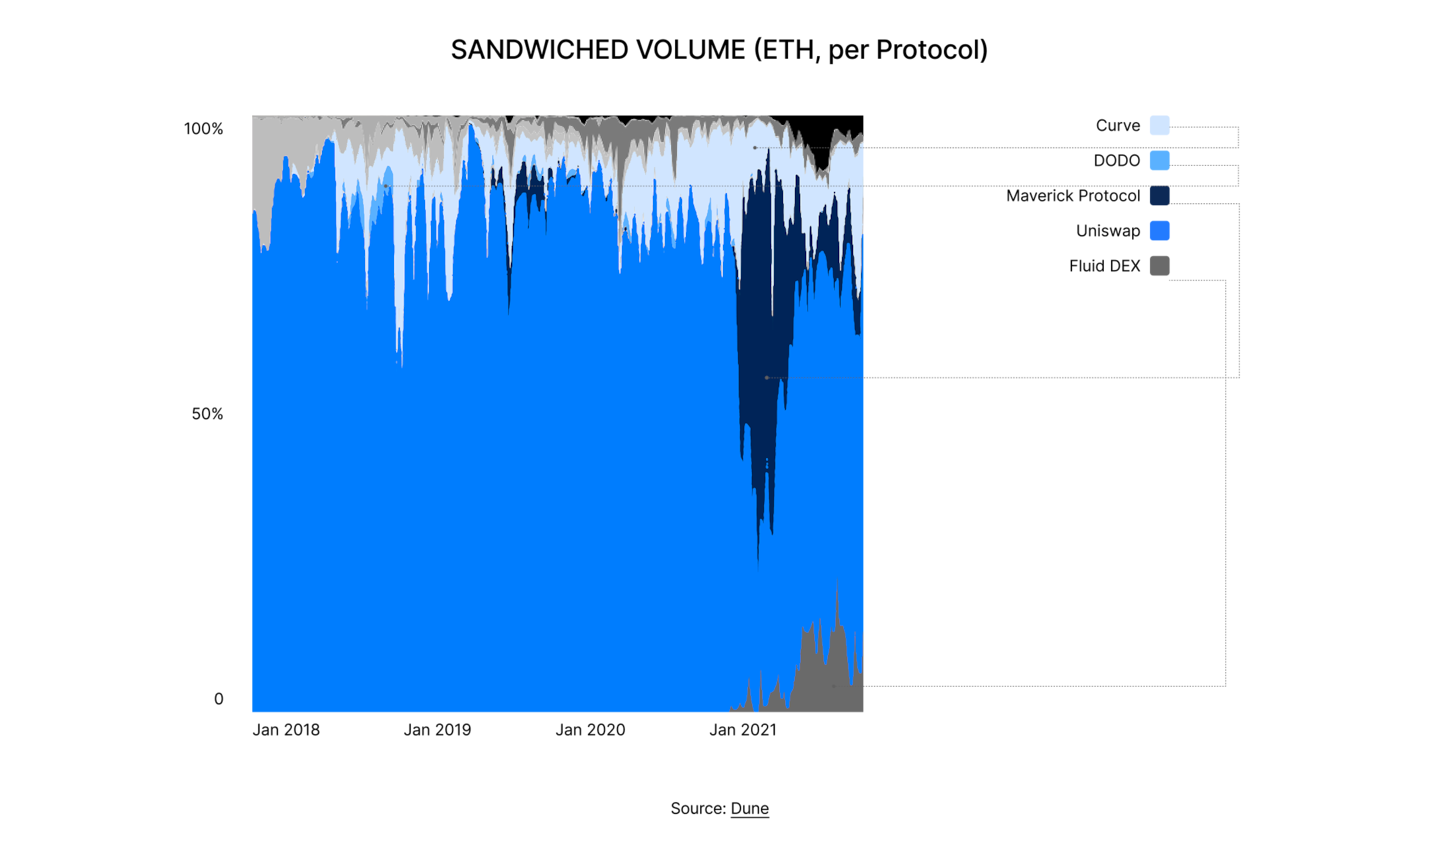
Most importantly, the share of blocks containing sandwich trades stops rising structurally in 2024 and stabilises into 2025, even as DEX trading remains ubiquitous. Nearly all Ethereum blocks now contain at least some DEX activity, but the fraction that includes an actual sandwich no longer trends upward. This marks a meaningful break from 2020–2022, when rising DEX usage mechanically translated into rising sandwich penetration. The decoupling suggests that private routing, wallet-level protection, and aggregator filtering are now materially dampening user exposure to toxic MEV, even though extraction itself persists in the background.
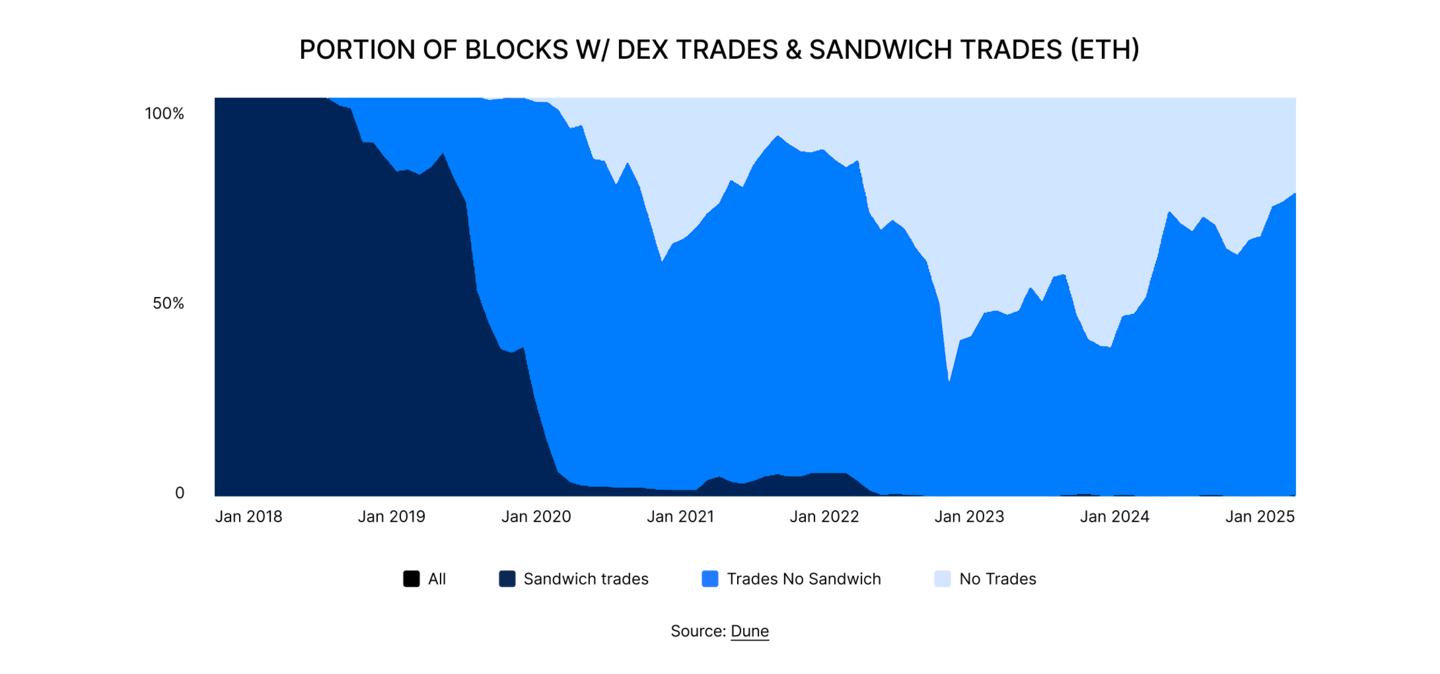
In contrast to 2024, when both total bot counts and sandwich penetration were still rising, 2025 represents a plateau phase for toxic MEV on Ethereum. Extraction remains large in aggregate, but its growth is no longer exponential, and its visibility to the median user continues to decline
BNB Chain: Enshrined MEV and Builder-Led Block Production
BNB Chain’s MEV architecture in 2025 reflects a structurally different approach from Ethereum’s relay-based PBS market. Rather than treating MEV as an open competitive layer on top of a public mempool, BNB has embedded MEV directly into its default block production process through its builder framework.

This transition is clearly visible in the MEV block percentage chart. Throughout 2024, the share of MEV blocks rises steadily from near zero to a clear majority of total blocks. In 2025, this share converges near saturation, indicating that by mid-2025, most BNB blocks are produced through MEV-aware builders rather than conventional validator-side construction.
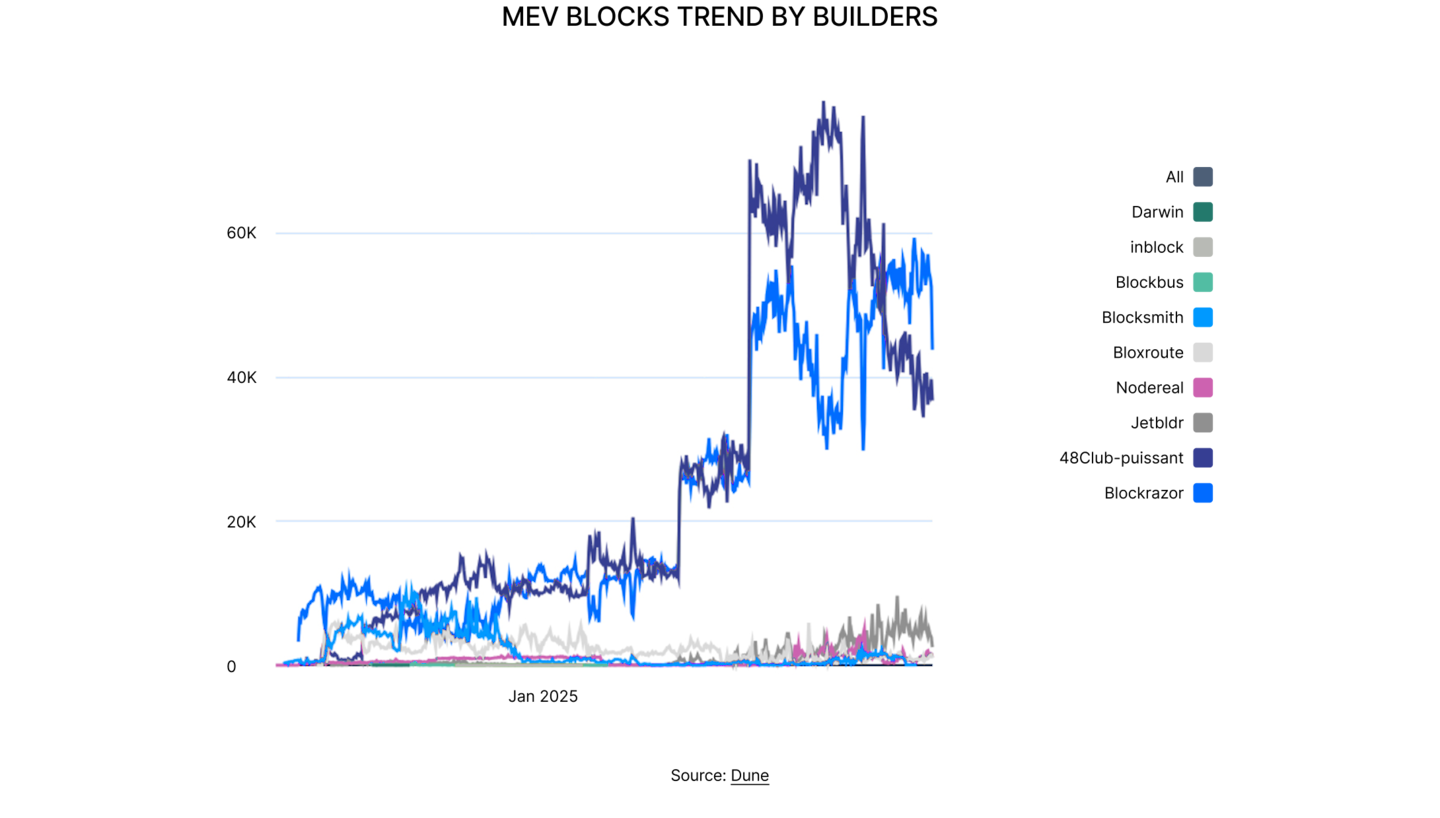
This shift is not only about adoption but also about who controls block construction. The builder trend chart shows a sharp step-change in absolute builder activity in 2025, with total MEV blocks roughly doubling over a short period as network-wide routing into builders becomes standard. Within that growth, output is highly uneven.
48Club-puissant and Blockrazor scaled aggressively into the tens of thousands of blocks per period, while the remaining builders remain clustered near the lower end of the distribution. This indicates that the growth of MEV on BNB is being driven by a small number of high-throughput industrial builders rather than broad-based participation.
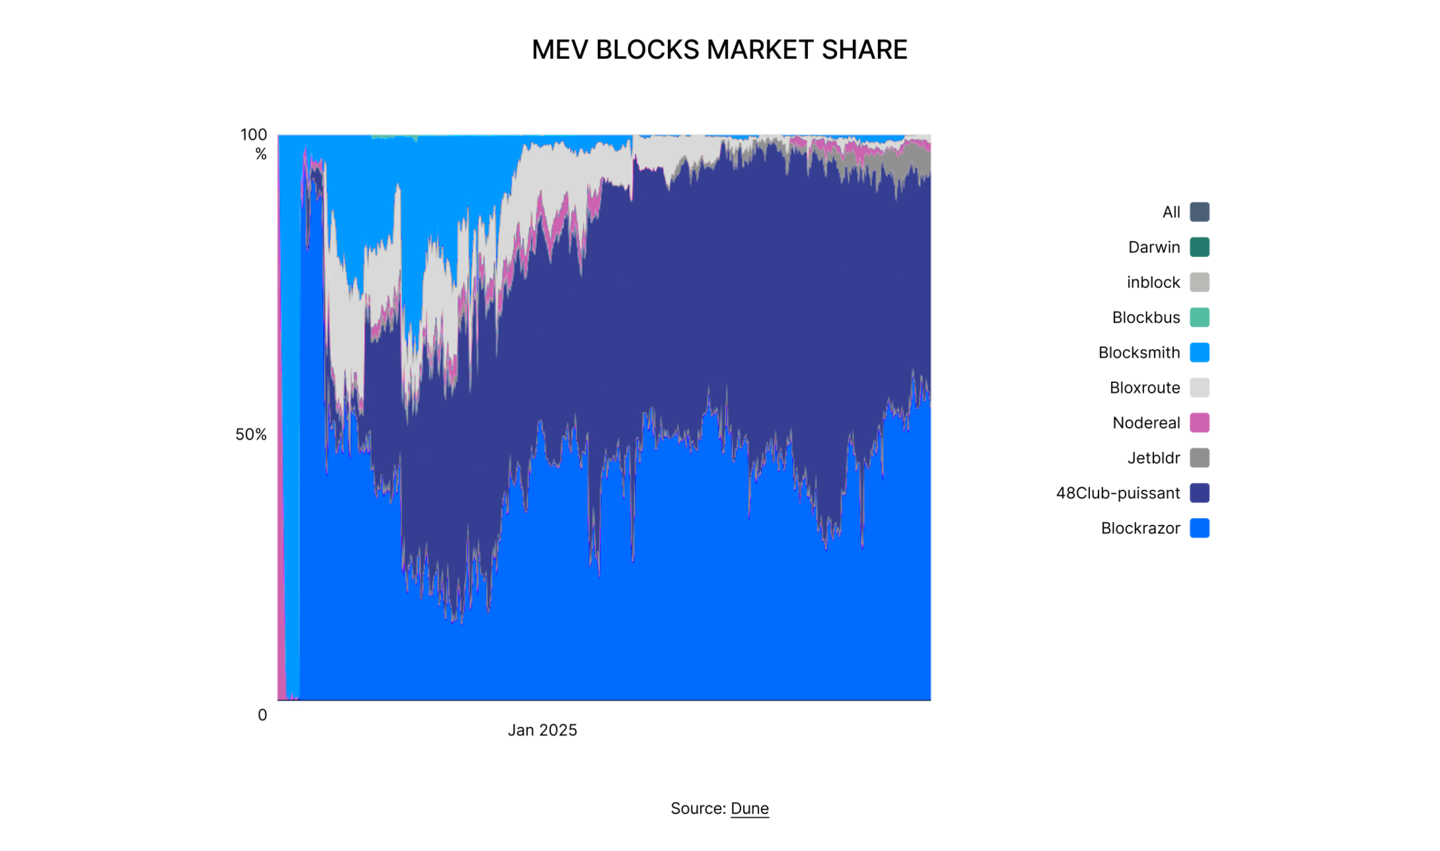
This structure contrasts clearly with Ethereum’s MEV design. Ethereum continues to operate with a permissionless searcher layer and multiple public relays, even as economic influence has concentrated in practice. BNB has taken a different path by moving toward a coordinated, infrastructure-led MEV model, where builders are not just competing service providers but a core part of block production itself. As a result, MEV on BNB is captured and routed upstream at the infrastructure level rather than emerging from transaction-level mempool competition.
Relative to 2024, the key change in 2025 is the completion of BNB’s transition from partial builder adoption to fully systemic MEV block production. In 2024, MEV existed alongside traditional blocks as an increasingly important routing layer. In 2025, MEV has become the production path. At the same time, the builder market has consolidated rather than diversified, showing that scale, latency, and validator relationships now dominate competition.
Looking ahead to 2026, this structure suggests that BNB’s MEV market is likely to remain highly concentrated, with incremental gains coming from throughput and efficiency rather than new entrants.
Solana: High-Frequency MEV and Validator-Centric Revenue Capture
Solana’s MEV market in 2025 is defined by extremely high execution throughput and a revenue model that is structurally concentrated at the validator layer. Unlike Ethereum and BNB Chain, where MEV is routed through multi-layer builder and relay markets, Solana’s MEV is primarily monetised through direct tip payments to validators via Jito’s bundle auction system. This design produces a MEV economy that resembles high-frequency trading more than batch auction blockspace markets.
In 2025, Solana validators received a total of 4,252,425 SOL in Jito tips, equivalent to $543.45 million, establishing the gross scale of onchain MEV revenue transferred directly to block proposers over the year.
Tip revenue was heavily front-loaded, with the largest daily volumes recorded in January and early February, followed by a sustained decline over the remainder of the year. By the second half of 2025, daily tips had stabilised at a materially lower level than at the start of the year. This pattern indicates that the bulk of Solana’s MEV revenue in 2025 was generated during periods of elevated volatility and launch-driven activity in early Q1.
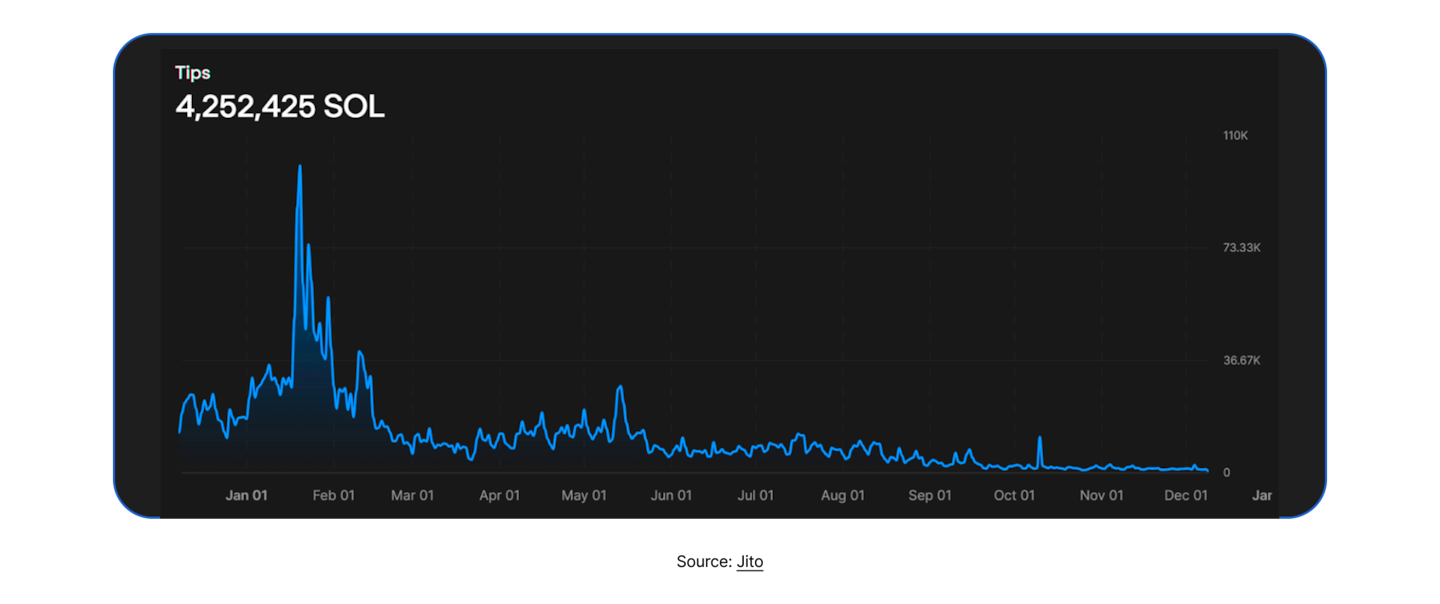
At the same time, activity at the searcher layer remained extremely high. Over the year, 6.45 billion Jito bundles were submitted to validators for execution. Bundle volume rose into mid-2025, peaked around early summer, and then trended lower into Q4 while remaining structurally elevated. The combination of falling tip revenue and persistently high bundle submission shows that MEV competition on Solana intensified throughout the year. More bundles were required to capture a shrinking pool of extractable value, concentrating profitability among searchers with the lowest latency and strongest validator connectivity.
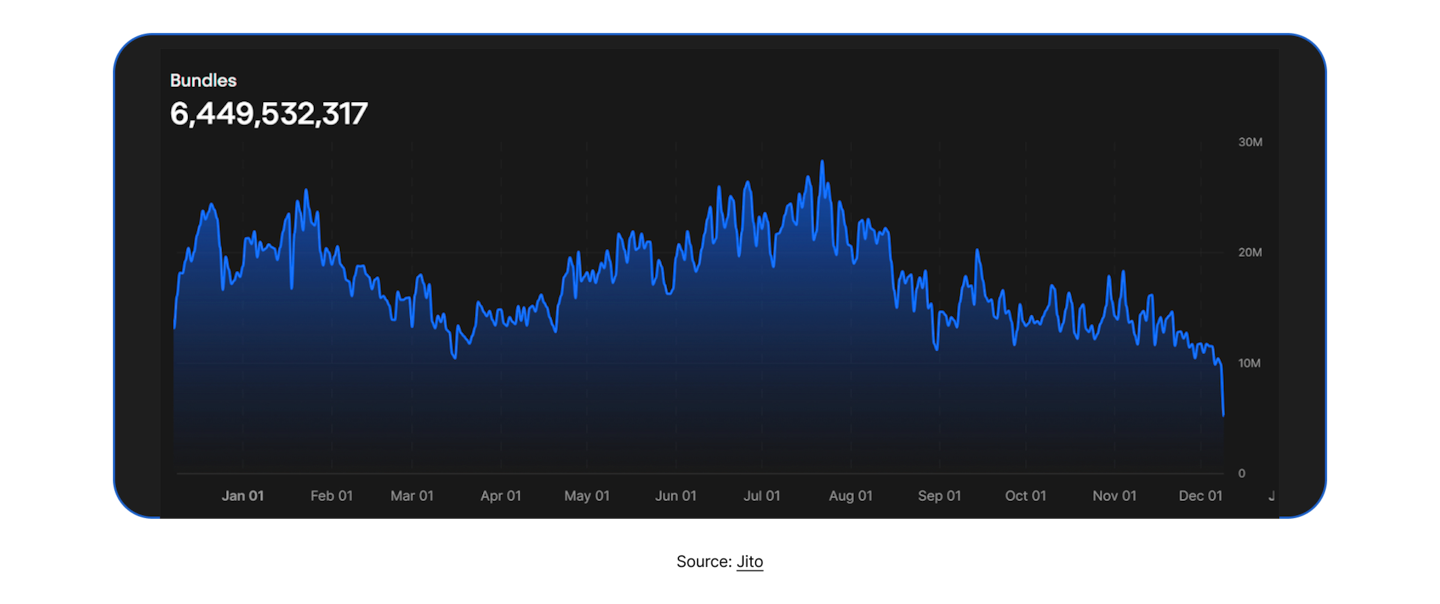
The distribution of MEV revenue on Solana is, therefore, validator-centric by construction. Validators capture the dominant observable share of MEV through tips, while searchers compete in a continuous real-time priority market for execution. There is no persistent builder layer extracting structural rents, and no relay layer interposed between bidders and proposers.
Compared to Ethereum, where MEV revenue is split across searchers, builders, relays, and proposers, and to BNB Chain, where MEV is internalised by a small builder oligopoly and redistributed to validators. Solana’s MEV pipeline is vertically integrated into a direct revenue flow from searcher to validator.
Relative to 2024, the defining change in 2025 is that Solana’s MEV market expanded dramatically in activity while compressing in economic density. Bundle throughput increased to billions of submissions annually, but aggregate validator tip revenue became increasingly concentrated in early-year market regimes and normalised at lower levels thereafter. MEV on Solana in 2025 therefore matured into a high-volume, infrastructure-driven execution market, rather than a cyclical arbitrage opportunity tied to transient inefficiencies.
Looking ahead to 2026, Solana’s MEV revenue profile is likely to remain validator-led and structurally high-frequency, with incremental revenue growth driven more by network throughput and trading velocity than by increases in per-trade extractable value.
Order Flow Routing and Fair Access
Public vs. Private Order Flow in 2025
By 2025, private transaction routing has become a structurally significant component of onchain activity on Ethereum.
MEV-Boost now intermediates the vast majority of block production, with consistently around 90% to 95% of blocks produced via MEV-Boost rather than vanilla clients throughout the year. This confirms that permissioned builder pipelines, rather than direct proposer construction, are now the dominant path for transaction inclusion.
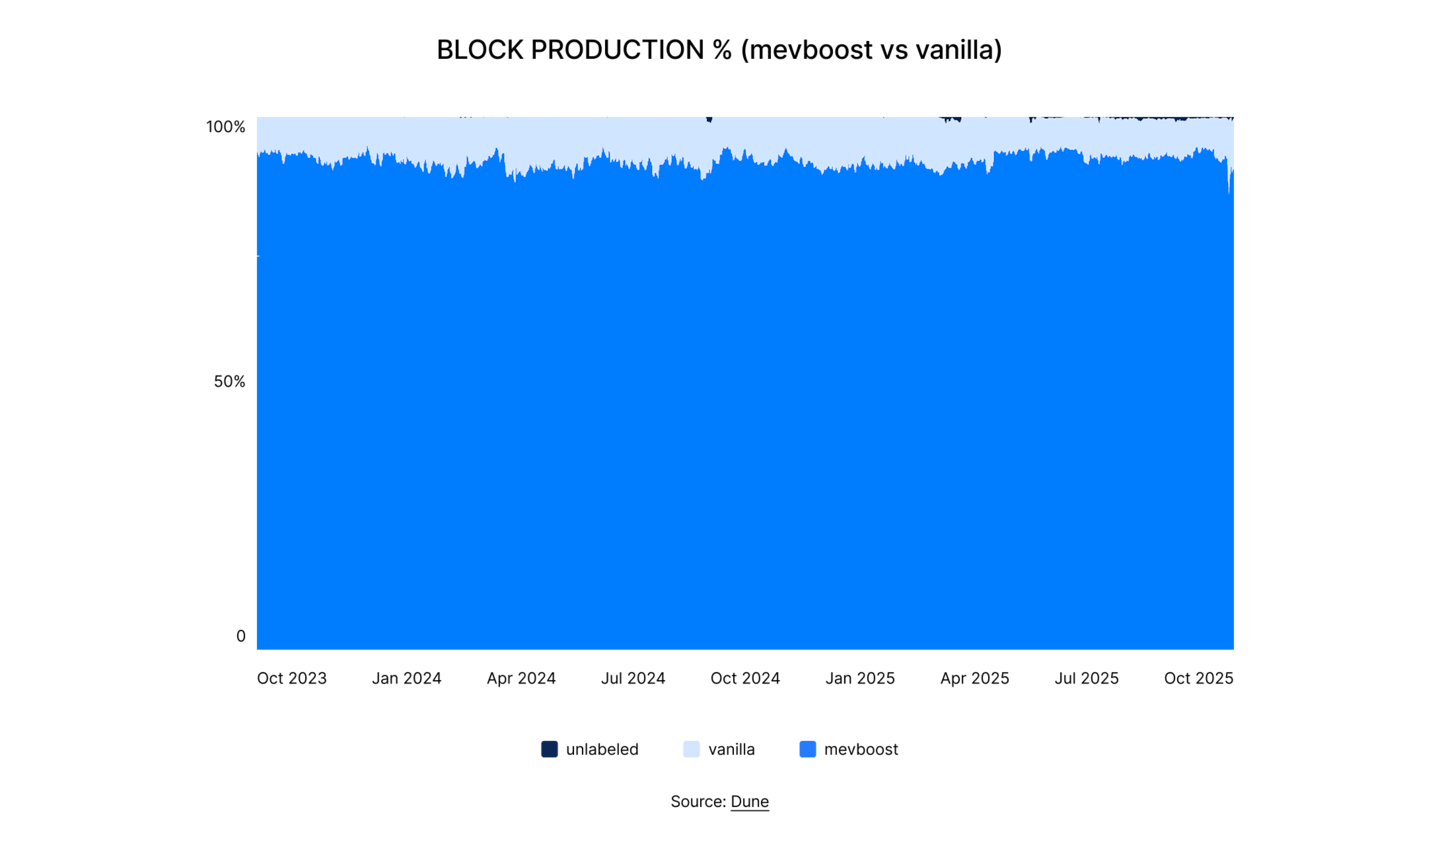
In parallel, the share of Ethereum transactions entering through private mempools has risen steadily through 2025, reaching roughly 35% to 45% of daily transactions by year end, up from low teens levels in early 2024. This implies that a material portion of user order flow is now shielded from the public mempool and instead routed through private relays, order flow auctions, and solver based systems.
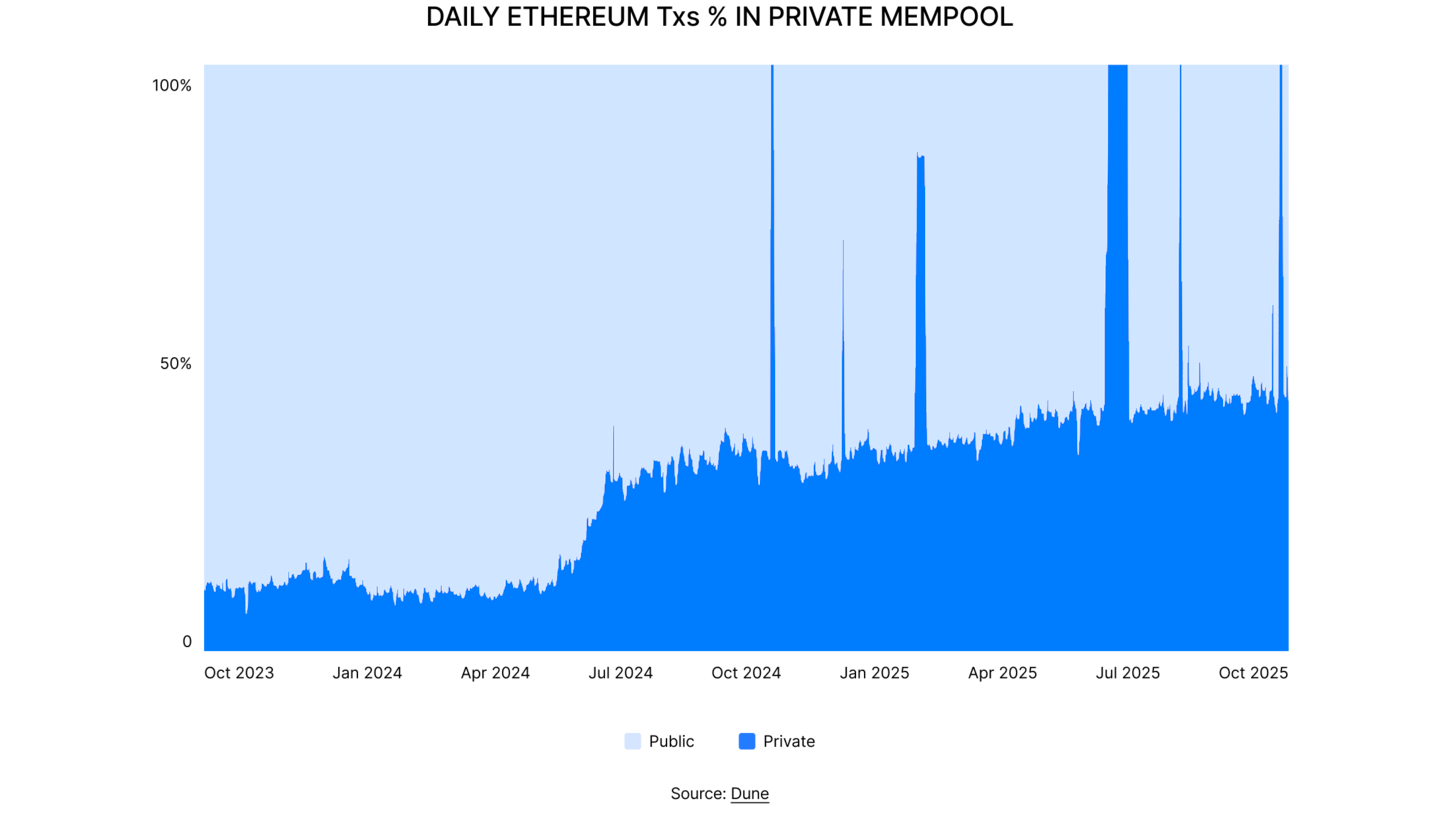
Public mempools therefore, remain the primary venue for retail and permissionless submission, but they no longer represent the majority pathway for economically sensitive flow. High-value swaps, liquidations, arbitrage legs, and large trades are increasingly routed through protected channels where execution is negotiated off-mempool before reaching builders.
The structural implication for 2025 is that Ethereum has transitioned from a hybrid public and private routing regime into a dual track system, where:
- Public mempools dominate numerically in transaction count
- Private mempools dominate economically in MEV dense flow and priority inclusion
This shift materially alters who can compete for order flow, as access to private routing infrastructure, not just gas bidding, now determines participation in the most profitable segments of blockspace.
RFQ and Solver Execution in 2025
By 2025, Cow Swap v3 had matured into a highly concentrated solver market. A small group of solvers consistently clears the majority of trades and batches. Helixbox, Odos, Gnosis_1inch, OKX and OneBit_Quant dominated settlement volume throughout the year.
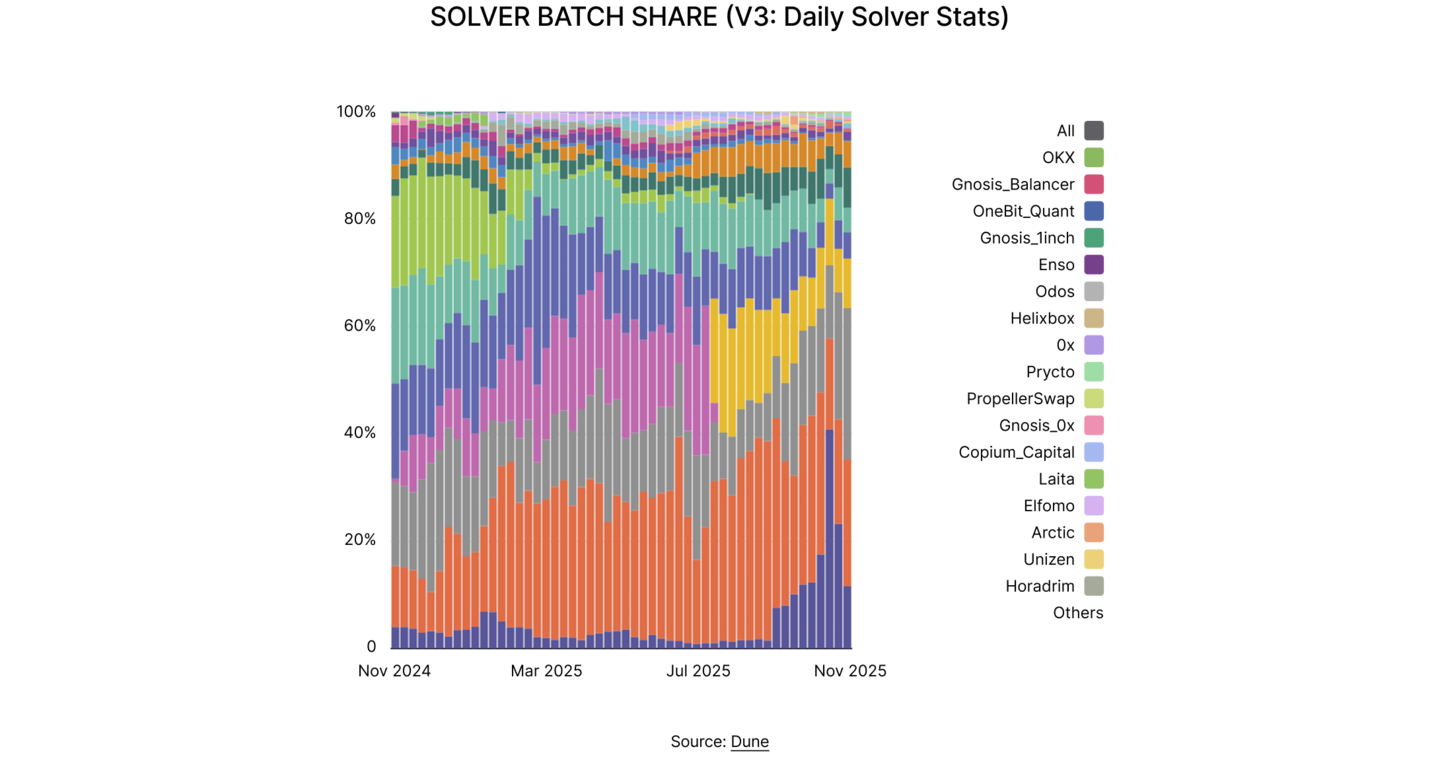
While early 2025 still shows rotation among these participants, the second half of the year is marked by stable leadership and declining long-tail participation. This indicates a transition from experimental solver competition in 2024 to an industrialised clearing layer in 2025.
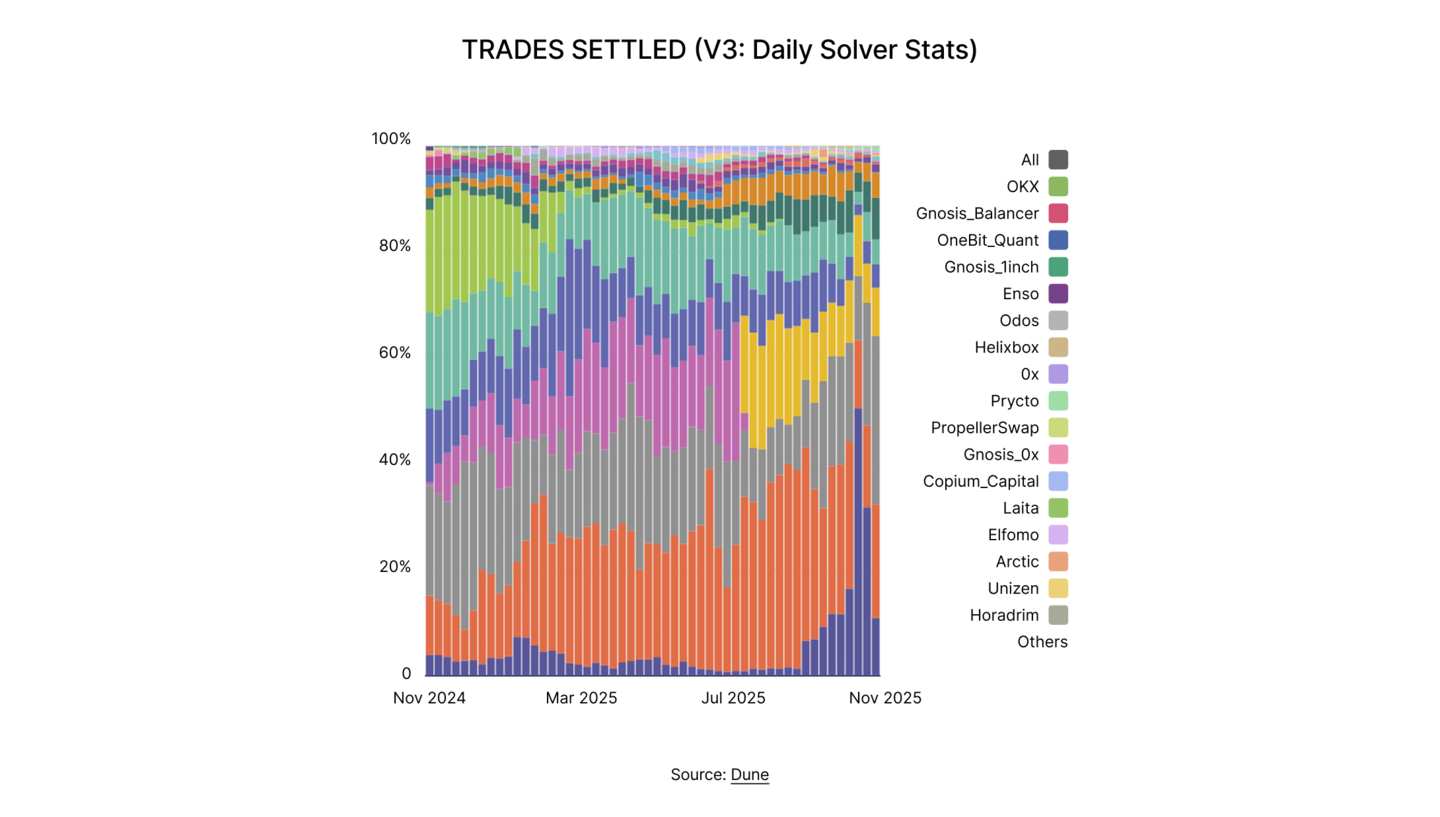
On the liquidity provision side, Wintermute alone fills roughly 71.4% of Cow Swap RFQs, with Symbolic Capital at 17.7%. All other RFQ market makers together account for just over 10%. In practice, this means that price discovery for the largest RFQ trades on Cow Swap is controlled by two firms.
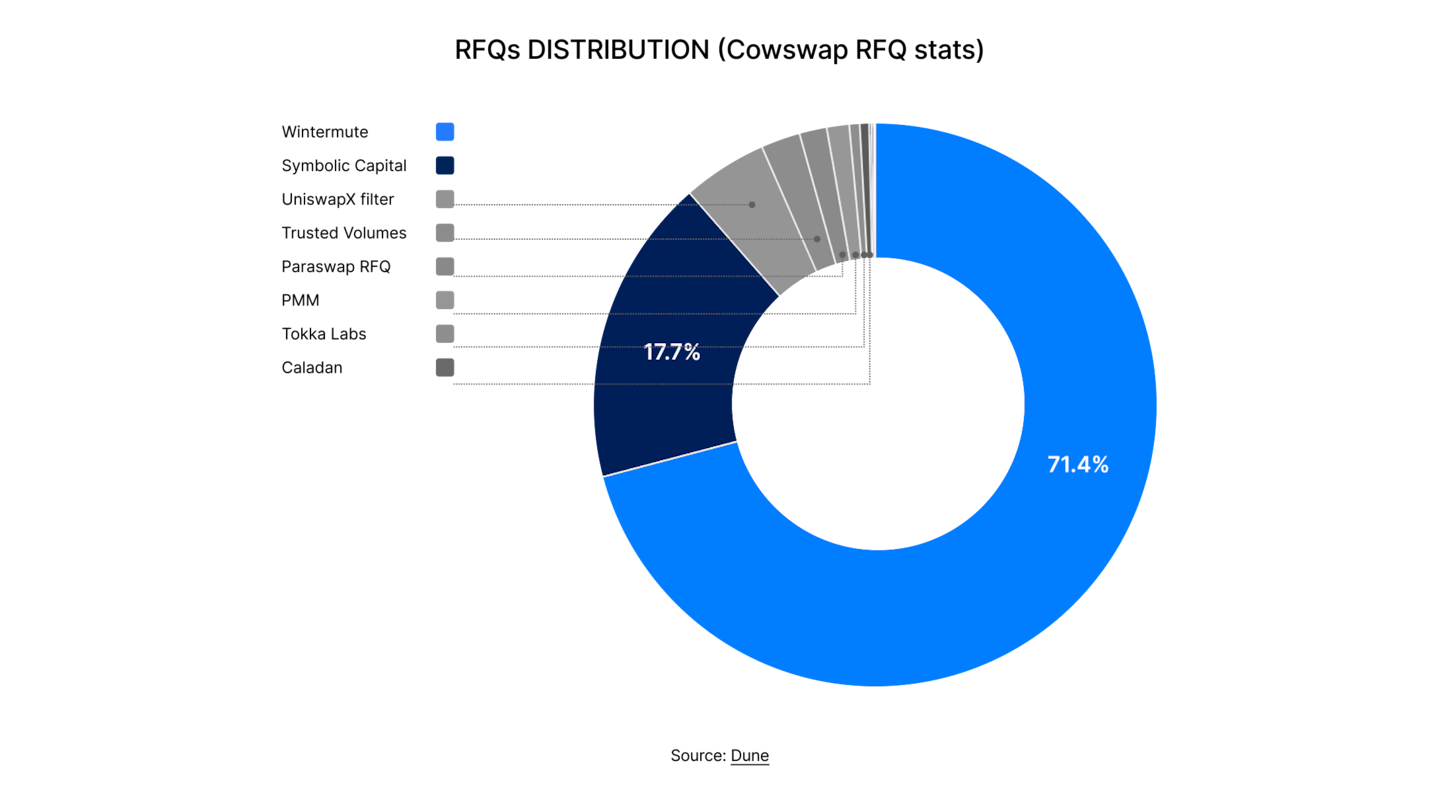
RFQ flow is heavily skewed toward core market assets. USDC represents about 30.7%of RFQ volume, followed by WETH at 25.2% and USDT at 14.8%. Wrapped Bitcoin assets add a further 13% combined. Long-tail tokens make up only a small residual. Most economically significant flows are therefore executed through RFQs rather than public AMMs.
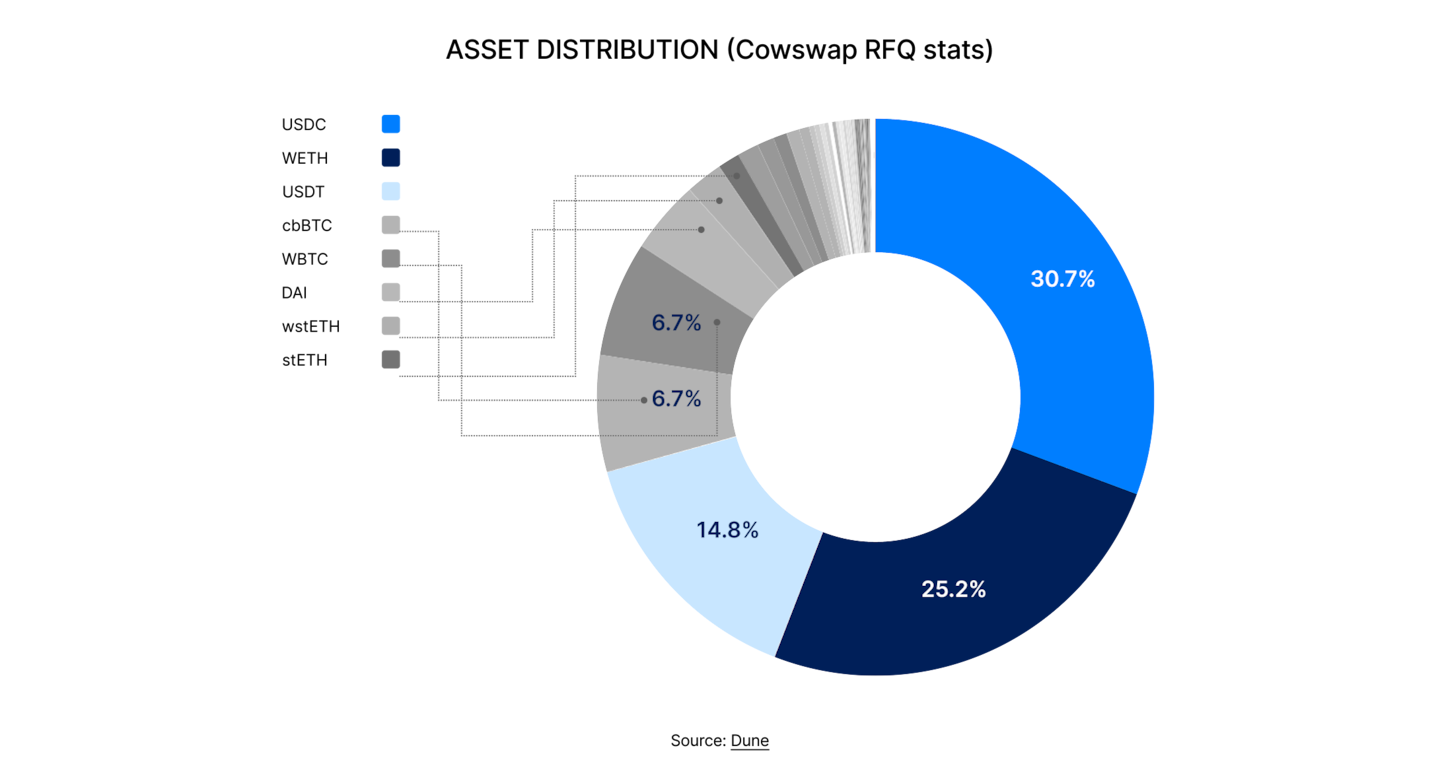
Taken together, the 2025 data show that large-sized Ethereum order flow has shifted decisively toward private, solver-mediated execution. While public AMMs still serve retail and long-tail trading, the majority of high-value stablecoin, ETH and BTC flow now routes through a small set of solvers and RFQ market makers. This improves execution quality for users but concentrates pricing power and flow control into a narrow institutional layer.
Execution Quality vs Market Structure Risk
By 2025, private order flow has become the dominant execution channel for large Ethereum trades. RFQs and solver-based routing consistently deliver tighter spreads and lower slippage than public pools for size-sensitive flow. For end users, this has translated into materially better execution outcomes on blue-chip assets and stablecoins.
The structural cost of this improvement is a sustained decline in pre-trade transparency. Price formation increasingly occurs inside private systems and only becomes visible at settlement. This reduces observable liquidity, weakens public price discovery, and limits competitive access to professional order flow.
At the same time, solver and RFQ activity is highly concentrated. A small number of firms now intermediates a disproportionate share of high-value trades. This introduces operational concentration risk and shifts market power away from public liquidity venues toward a narrow set of private intermediaries.
If current trends persist, 2026 is likely to see further entrenchment of private execution as the default for institutional-sized DeFi trading. The key risk is not reduced efficiency, but increased dependence on a small number of solvers and RFQ market makers. Protocol design choices in the next cycle will largely determine whether competition broadens or whether order flow centralisation deepens further.
Privacy protocols and selective disclosure
Zcash and the Re-Emergence of Compliant Privacy in 2025
Zcash regained structural relevance in 2025 as demand for compliance-compatible privacy increased across crypto markets.
While total transaction counts declined year-over-year, the share of shielded transactions rose sharply, reaching ~19% by late 2025, more than doubling its 2024 level. This divergence indicates that marginal network usage in 2025 was increasingly driven by privacy-motivated flows rather than retail payments or speculative activity.
This shift coincided with the network’s continued consolidation into the Orchard shielded pool, which surpassed 4.1 million ZEC in shielded supply by year-end. Legacy Sapling usage continued to decline, and transparent balances trended lower. By 2025, the overwhelming majority of active privacy users were operating through Orchard, reflecting near-full migration to the modern shielded stack.
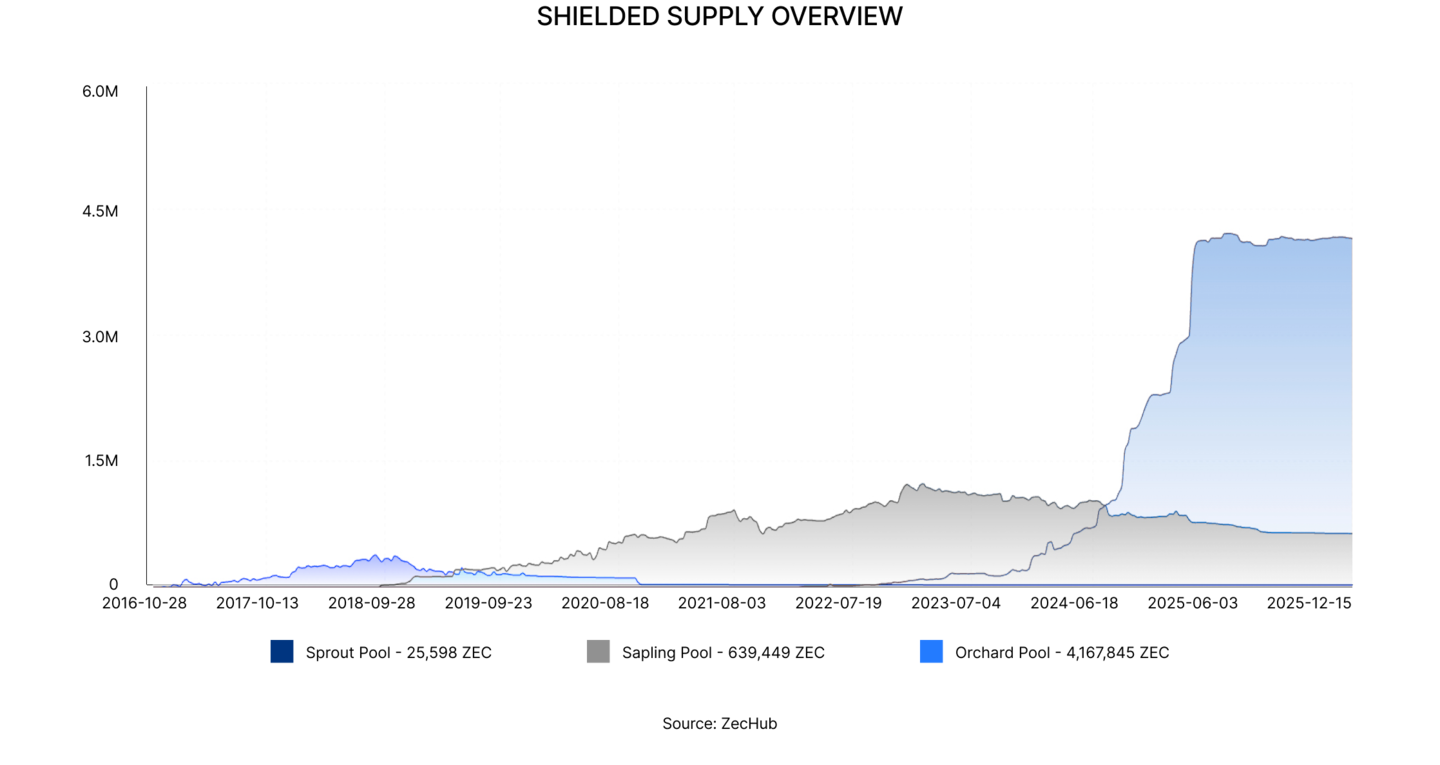
Protocol upgrades and roadmap developments in late 2024 and 2025 improved wallet support, multisig compatibility, and address flexibility, lowering the operational friction of using shielded Zcash in institutional settings. At the same time, Zcash’s view-key architecture preserved auditability, allowing it to remain supported by regulated exchanges and custodians at a time when non-disclosing mixer systems continued to face structural constraints.
Taken together, Zcash’s 2025 activity profile reflects a transition from broad retail experimentation toward specialized, compliance-aware privacy usage, positioning it as the only large-scale public blockchain where privacy, regulatory compatibility, and exchange connectivity coexist at production scale.
Regulatory and Institutional Lens on Execution Quality
In 2025, regulators did not directly regulate MEV, dark routing, or cross-venue execution mechanics. What changed is how these issues are framed. Execution quality in crypto is now increasingly treated as a market integrity and conflicts-of-interest problem, rather than a purely technical feature of blockchains.
The focus has shifted away from protocol design and toward who controls transaction ordering, who benefits economically, and whether users are systematically disadvantaged.
Europe
In Europe, this reframing became explicit with ESMA’s July 2025 risk analysis on MEV. ESMA concludes that MEV transfers value from ordinary users to extractors, often without user awareness, and raises “serious transparency, fairness, and market integrity concerns.” The report draws a direct parallel to traditional finance by noting that front-running MEV mirrors illegal front-running in traditional markets, even if it is enabled by blockchain mechanics.
ESMA also highlights conflicts created by private relays, wallet providers, and offchain service providers that can redirect user transactions to preferred counterparties without informed consent. Importantly, ESMA states that MiCA does not directly address DeFi or MEV, but that MEV may still fall within market-abuse reporting and supervisory scrutiny under MiCA’s suspicious transaction reporting framework
This European framing is reinforced at the consumer-protection level. In 2025, the European Supervisory Authorities issued a joint warning stating that MiCA authorization does not remove execution, liquidity, or manipulation risk. The message was aimed at platforms using regulated status as a proxy for safety, even when market-structure risks such as opaque routing and internal execution remain. While the warning does not name MEV explicitly, it establishes a clear supervisory position that regulatory licensing does not neutralize execution risks.
United Kingdom
The United Kingdom remains more cautious. The FCA’s 2025 crypto consultations focus on authorisation, custody, market abuse, and systems and controls. They do not impose formal best-execution obligations on crypto trading. The UK approach in 2025, therefore, reflects principled convergence without rule-level convergence. Crypto firms are expected to manage conflicts and governance risks, but there is still no requirement to demonstrate venue-by-venue routing outcomes or total-consideration optimization as in equities.
United States
In the United States, execution quality and MEV are being addressed through enforcement and examinations rather than formal rulemaking. There is still no crypto-specific best-execution standard, but routing, transaction ordering, and MEV-related conduct are increasingly being tested under existing fraud, fiduciary, and market-integrity laws.
The clearest example in 2025 is the Peraire-Bueno criminal case, in which federal prosecutors accused two MIT-educated brothers of exploiting Ethereum’s transaction-ordering infrastructure to extract $25 million in seconds. In November 2025, a federal judge declared a mistrial after the jury failed to reach a verdict. The case did not create precedent, but it established that US authorities are willing to frame MEV-style ordering as potential wire fraud and market manipulation, even in the absence of crypto-specific execution rules.
At the regulatory level, the SEC’s 2026 Examination Priorities, published in late 2025, removed crypto as a standalone category and folded crypto trading into traditional review areas such as conflicts of interest, fiduciary duty, order handling, and standards of conduct. This signals that crypto execution is now being evaluated under the same supervisory lens as traditional markets rather than under a bespoke crypto framework.
Digital Asset Treasuries: From Boom to Reckoning
Digital asset treasuries became one of 2025’s defining narratives, evolving from an experimental capital allocation strategy into a globally recognised financial phenomenon.
What began in 2020 with Michael Saylor’s Strategy’s (formerly MicroStrategy) initial Bitcoin purchases expanded into a sector worth over $112 billion at its peak, encompassing 195 listed companies that collectively hold over 1 million Bitcoin. By December 2025, however, the model faced its most serious stress-test as premiums compressed and price declines — by both Bitcoin and company stocks — exposed fundamental vulnerabilities in the treasury thesis.
In the early days, the mechanics appeared pretty straightforward. Companies would raise capital through equity offerings, convertible debt, or preferred shares, then deploy the funds into Bitcoin en masse.
For months, companies raised billions, while their share prices skyrocketed. From Japan to the US, new treasuries were birthed nearly every day, garnering the attention — and capital — of both retail and institutional investors.
Why were so many treasuries being created? For one, these companies were commanding premium valuations. Market-to-net-asset-value ratios, or mNAV, measures how much investors will pay above the underlying Bitcoin holdings.
An mNAV above 1 means the market assigns additional value beyond the coins themselves, effectively allowing companies to create leveraged Bitcoin exposure for shareholders. At its peak in early 2025, companies traded at 4x mNAV or sometimes even higher, meaning a dollar of Bitcoin on the balance sheet translated to four dollars of market capitalisation.
Throughout early 2025, the sector enjoyed a rapid expansion as regulatory clarity improved, and Bitcoin’s price action helped companies raise billions. Major corporations entered the space, including videogame retailer GameStop, which raised $1.5 billion through convertible notes specifically issued to fund Bitcoin purchases.
Even Donald Trump’s media conglomerate wanted a piece of the action, and is now the 11th largest Bitcoin treasury with over 11,500 Bitcoin worth about $1 billion.
Japan’s Metaplanet — a former budget hotel operator turned top Bitcoin treasury — emerged as the dominant international player. The firm has accumulated more than 30,000 Bitcoin while trading at substantial premiums due to Japan’s punitive tax treatment of direct crypto ownership.
Mining companies such as MARA Holdings and CleanSpark pivoted from selling newly mined Bitcoin to implementing systematic strategies for holding. Miners began treating new production as continuous accumulation rather than revenue.
The buying frenzy peaked in July 2025, when 118 companies acquired 103,000 Bitcoin in a single month.
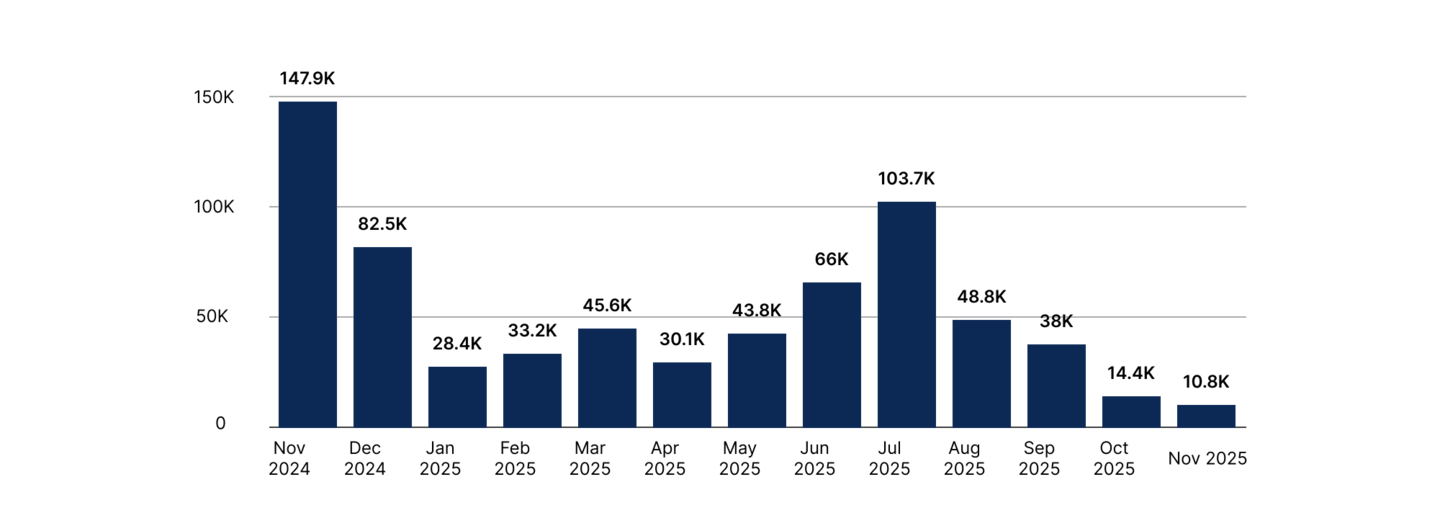
Mid-year brought an unexpected development: Ethereum treasuries emerged as a parallel movement with distinct structural advantages. What barely existed in April exploded by the Northern Hemisphere’s summer — 68 firms hold more than $20 billion in Ether by December, accomplishing in six months what took Bitcoin treasuries over five years.
Ethereum treasury companies have one key differentiator when compared to Bitcoin treasuries: yield.
Ether generates compounding returns through 3% staking yields and DeFi protocols, creating a flywheel effect where treasury companies stake their ETH, earn more ETH, then use the additional returns to justify higher stock premiums. Higher premiums enable more capital raises, which fund more ETH purchases, which generate more yield.

Bitcoin treasuries, by contrast, can only buy and hold — there’s no staking, no DeFi, and no compounding. Ethereum’s dominance in the $300 billion stablecoin market where over half of all stablecoins operate on Ethereum rails, has also positioned it as what VanEck CEO Jan van Eck called “The Wall Street token.” Financial institutions building stablecoin infrastructure have no choice but to engage with Ethereum, creating structural demand that Bitcoin treasuries cannot replicate through pure scarcity narratives.
BitMine rapidly emerged as the dominant player in the Ethereum treasury space, positioning itself as the Strategy equivalent for Ether holders and consolidating market share through aggressive accumulation while competitors remained fragmented. Right now, the company led by Wall Street strategist Tom Lee holds 50% of all the Ether held by treasury companies.
As time passed, the financial engineering scheme grew increasingly sophisticated. Strategy pioneered the use of perpetual preferred equity shares — hybrid securities that function like stocks but pay fixed dividends like bonds, ranking above common shares in liquidation but typically lacking voting rights — allowing the company to raise capital while offering fixed yields to investors without immediately diluting common shareholders.
These structures blurred traditional categories, functioning simultaneously as equity instruments, fixed-income products and leveraged commodity exposure. For investors seeking Bitcoin returns without direct ownership, treasury companies offered liquidity, regulatory compliance, potential dividends and the ability to trade in traditional brokerage accounts.
Strategy alone raised over $20 billion between August 2020 and late 2025, selling investors on the thesis that Bitcoin would outperform traditional assets and that the company’s equity would trade at a persistent premium to its net asset value.
But by late 2025, the model has largely collapsed under its own weight.
Bitcoin fell 25% from October highs above $120,000, but equity collapses proved far worse, revealing that premium compression, not Bitcoin’s price decline, was destroying shareholder value.
Strategy shifted to a 16% discount to its Bitcoin holdings from a sevenfold premium two years earlier, while Metaplanet’s premium collapsed to just 7% from 237% earlier in the year. Moreover, of 195 treasury companies tracked by BitcoinTreasuries.net, only one managed to outperform the SandP 500’s 16% return: France’s The Blockchain Group, which soared 164%.
Other major equities have shed value. Strategy, for instance, declined 12%, Metaplanet lost nearly one-third of its stock price, and Nakamoto — the self-proclaimed treasury company for treasury companies that raised over $600 million — bled out over 98%.
Roughly 60% of treasury companies are underwater on their Bitcoin investments, and monthly buying activity collapsed 83% from its July peak to just 28 companies in November. When equity trades at a discount to Bitcoin NAV, issuing shares destroys shareholder value, eliminating the mechanism that sustained the model.
Despite the late-stage market stress affecting both Bitcoin and digital asset treasuries, most market watchers are adamant that the model is here to stay. Whether it will be a “winner-takes-most” scenario, with most capital concentrated at the top, or if money will flow down the spectrum, is one only time will tell.
Airdrops, Governance, and Token Design
Airdrops, Points and User Acquisition
Airdrops remained the primary distribution and user acquisition mechanism for new networks and applications. To understand the current state of airdrops, we examine five campaigns that made waves during the year.
Across these examples, a consistent pattern emerges. Large recipient counts rarely translate into broad token ownership. Even when distributions reach many addresses, realised ownership quickly concentrates among a small group of top holders.
Claim behaviour also tends to fall into a small number of distinct patterns. Some airdrops see most claims completed within hours, effectively turning distribution into a single market event. Others extend claims over several days, gradually increasing the amount of circulating supply.
This section focuses on what can be observed directly onchain, including distribution structure, claim timing, and early post-claim token movement, to illustrate how modern airdrop design works in practice.
Campaign Design and Outcomes
On the surface, 2025 airdrops reached a wide set of participants. Most campaigns in this sample distributed tokens to tens of thousands of addresses, reflecting a continued emphasis on broad eligibility. However, examining the distribution more closely shows that ownership remains concentrated by design.
Across all five campaigns, the top 10% of recipients capture between roughly 70% and 96% of total supply. The bottom 50% of addresses, by contrast, receive between 0.2% and 6.9%. Even in relatively less concentrated distributions such as Monad and Bera, the majority of economic ownership accrues to higher-ranked recipients.
This pattern suggests that recent airdrops are structured to differentiate strongly between participant tiers. Broad address-level distribution expands reach and awareness, while allocation size remains closely tied to contribution, usage, or capital intensity. As a result, recipient count alone overstates the degree of economic decentralisation.
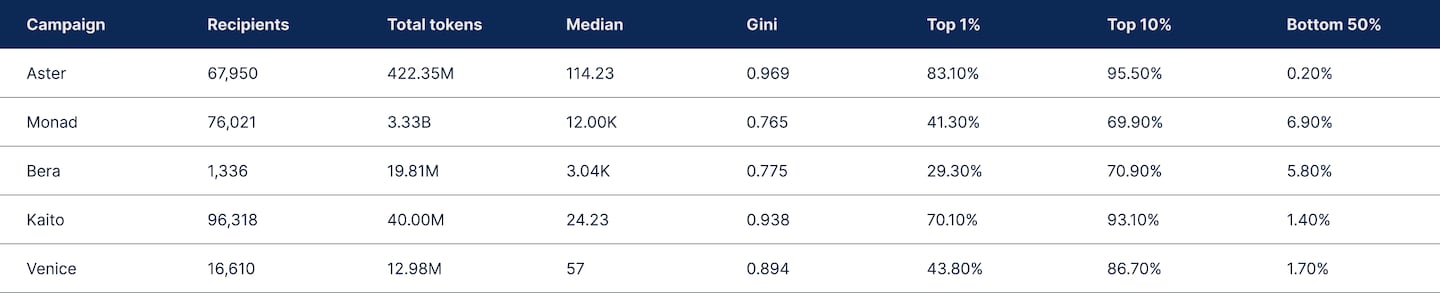
Claim Timing Shapes How Supply Enters the Market
Claim timing differs meaningfully across 2025 airdrops and has a direct impact on how quickly supply becomes liquid.
Some campaigns, including Kaito, Venice, and Bera, see claims concentrate immediately after launch. Around 70$ to 75% of total eligible supply is claimed within the first day, and half of all claims are completed within hours. In these cases, the airdrop effectively functions as a coordinated supply release, with most tokens becoming transferable over a short time horizon.
Other campaigns, such as Aster, show a slower claim profile. Fewer than 20% of tokens are claimed on day one, and it takes roughly three days to reach the 50% claim mark. This delays the point at which the full supply becomes available and extends the period of incremental issuance.
The distinction reflects different priorities rather than execution quality. Fast-claim distributions favor immediate liquidity, clearer price discovery, and rapid market formation. Slower claim schedules reduce the pace at which supply enters circulation and can moderate short-term market dynamics. In practice, claim timing has become a key design lever alongside eligibility and allocation size in 2025 airdrop campaigns.
Conclusion: Airdrops After the Points Era
In 2025, airdrops remained the primary mechanism for token distribution and early user acquisition, but their role and structure continued to evolve. While campaigns reached large numbers of addresses, onchain evidence shows that economic ownership was never broadly dispersed. Across the observed distributions, a small fraction of recipients consistently captured the majority of supply, reinforcing the view that modern airdrops function less as egalitarian giveaways and more as targeted allocation events.
Recipient counts, therefore, increasingly reflect surface-level reach rather than meaningful economic decentralisation. Even in comparatively flatter distributions, ownership concentrates quickly, either by design or through early post-claim behaviour. In practice, 202,5 airdrops prioritised rewarding high-intensity users, capital providers, and other strategically important participants, while broad eligibility mainly served to expand awareness and bootstrap network effects.
Points systems, which dominated incentive design in 2024, played a more limited and specialised role in 2025. Points remain a valid coordination tool, particularly for perpetual exchanges and other trading-focused protocols where ongoing activity and volume can be measured continuously.
Outside of these use cases, explicit points programs were less prevalent. Many teams instead embedded similar logic directly into allocation formulas or eligibility criteria, reducing the visibility of points and limiting speculative farming behaviour.
Looking ahead to 2026, airdrops are unlikely to disappear, but their function will continue to narrow. Fewer campaigns are likely to emphasise mass participation or open-ended engagement. Instead, token distributions are expected to concentrate more heavily on users with demonstrable economic impact, with allocation size tied closely to revenue generation, sustained usage intensity, and capital deployment. In this model, airdrops increasingly resemble retroactive compensation for value creation rather than broad distribution exercises.
Governance Health and Power Concentration
This section examines how onchain governance across major DeFi protocols evolved from 2024 into 2025, with a specific focus on participation rates, effective power distribution, and the practical outcomes of governance decisions.
While 2024 represented a high-water mark for DAO proposal activity and experimental governance frameworks, 2025 marked a clear transition toward consolidation, professionalisation, and delegate-driven control.
Participation and Power Distribution
Governance activity contracted sharply across the DeFi sector in 2025 relative to 2024. Proposal volume declined across all major DAOs in the sample, indicating a structural shift away from high-frequency onchain governance toward more bundled, council-driven, and operationally abstracted decision-making.
This contraction did not reflect a collapse in decision authority, however, as voting power deployed per proposal remained stable or increased, implying a shift from broad participation toward concentrated, delegated governance.
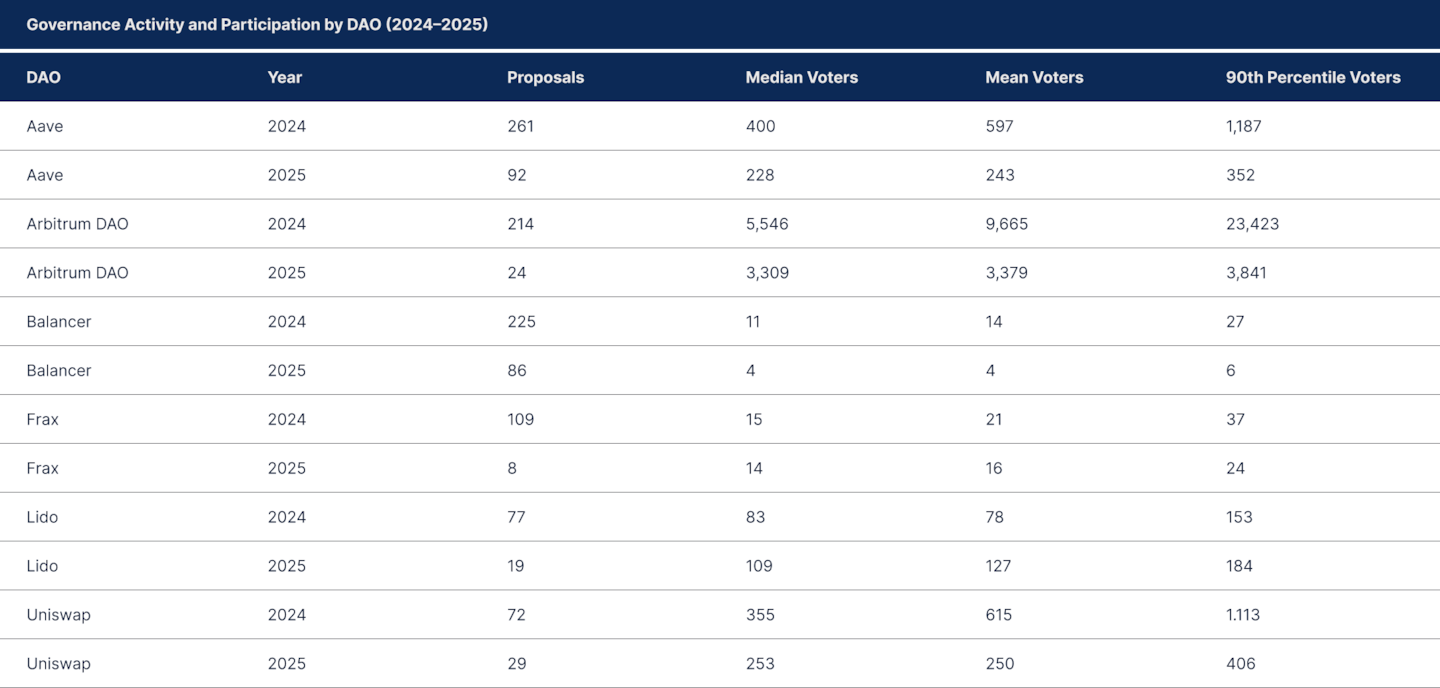
Across all six DAOs, proposal counts fell between 60% and 90% year-over-year. This decline was most pronounced at Frax and Arbitrum DAO, reflecting an exhaustion of broad incentive and experimentation cycles that dominated 2023–2024.
At the same time, median voter participation fell at every DAO except Lido, which experienced a notable increase in voter engagement in 2025 following the introduction of its dual governance framework. Arbitrum and Uniswap continued to exhibit the highest absolute participation, but both saw meaningful declines in address-level voter turnout.
Despite lower participation in terms of raw voters, the total voting power deployed per proposal remained stable or increased at most DAOs. This decoupling of participation from voting power provides direct evidence that governance influence has increasingly migrated toward a smaller set of highly active and well-capitalised delegates.
To quantify this effect, we compute voting power per participating voter as a proxy for effective concentration. While this metric does not replace address-level concentration analysis, it captures how much governance weight is carried by the marginal voter in practice.

Effective voting power per voter increased markedly across every DAO in the sample from 2024 to 2025. Uniswap’s median voting power per voter nearly tripled, while Balancer and Frax exhibited extreme concentration growth consistent with their vote-escrowed token models.
Aave’s per-voter voting power also increased materially even as absolute turnout declined, reflecting the rising importance of large, consistently active delegates and governance service providers.
This pattern confirms a structural shift in DeFi governance away from broad, retail-style token participation toward a model dominated by a relatively small group of professional delegates, large liquidity providers, protocol-aligned funds, and long-term strategic token holders.
From an institutional perspective, this transition improves governance predictability and operational coherence, but it also raises persistent questions around capture risk and minority tokenholder relevance.
Governance in Practice
In 2025, governance across the major DeFi DAOs shifted from high-frequency, participation-heavy decision making toward lower-volume, higher-impact interventions centred on risk management, token value capture, and crisis response.
Compared with 2024, DAOs used governance less as a coordination forum for continuous experimentation and more as a control layer for a smaller set of economically consequential decisions. This shift is visible both in the data, through lower proposal counts and higher voting power per voter, and in the substance of the decisions made during the year.
Case Study I: Aave and the Institutionalisation of Risk Governance
Aave’s 2025 governance posture represents the clearest example of a successful transition toward a formalised risk oversight framework. In 2024, Aave governance was characterised by frequent parameter adjustments across multiple deployments, with risk changes debated and executed through a steady stream of proposals.
This reflected both rapid market expansion and a reactive approach to volatility. By contrast, in 2025, Aave governance shifted decisively toward pre-authorised, automated risk management under the supervision of contracted risk service providers.
The year marked the full operationalisation of automated risk parameter frameworks managed by Chaos Labs and LlamaRisk. Governance votes are increasingly focused on approving structural guardrails and new market integrations rather than on adjusting individual loan-to-value ratios, caps, or interest rate curves.
Once these guardrails were in place, routine parameter updates were executed within predefined bounds, materially reducing the need for continuous governance intervention. As a result, overall governance activity declined in volume, but the economic weight of each decision increased.
This transition materially improved Aave’s positioning for institutional participation. For TradFi lenders, asset managers, and prospective RWA issuers, the combination of pre-approved automation, specialist oversight, and on-chain transparency resembles a formal risk committee model rather than an open-ended token vote.
The ability to demonstrate that leverage limits and liquidation thresholds are enforced continuously rather than episodically is particularly relevant for institutions subject to regulatory capital and internal risk control.
Case Study II: Uniswap and the Activation of Token Value Capture
Uniswap’s governance activity in 2025 was defined by a single structural inflection point: the activation of protocol-level value capture for UNI through the UNIfication and fee framework. For most of Uniswap’s history, governance avoided activating the protocol fee switch despite the protocol generating consistently large trading fee volumes. In 2024, discussions around value capture stalled repeatedly over regulatory concerns, LP alignment, and coordination between Uniswap Labs and the Uniswap Foundation.
In 2025, this changed. Governance approved a framework that unified governance authority, activated protocol fees for Uniswap v2 and v3, and introduced a mechanism to route a portion of fees toward systematic UNI burns. This transformed UNI from a pure governance asset into a token with direct economic exposure to protocol revenues. Market response to the decision was immediate as UNI repriced to reflect cash-flow participation.
The governance dynamics surrounding this shift were also instructive. The number of governance actions required to implement the change was relatively small compared with prior years, but the concentration of voting power behind these actions was materially higher. Economically decisive governance at Uniswap in 2025 was driven by a limited number of large delegates and aligned funds rather than broad retail participation.
Implications for TradFi and RWA-Oriented Protocols
Together, these two cases illustrate the dominant feature of DeFi governance in 2025: governance has become an instrument for managing structural economic and risk decisions rather than a forum for continuous experimentation. Aave demonstrates how DAOs can evolve toward formal risk oversight frameworks that resemble institutional risk committees. Uniswap demonstrates how governance can be used to activate and enforce token value capture once political and regulatory uncertainty is resolved.
For protocols that aspire to host significant TradFi or RWA activity, the implications are clear. Institutional participants are less sensitive to measures of voter participation and more focused on whether governance can credibly enforce leverage limits, manage balance-sheet risk, and support predictable economic policy under stress
Treasury and Token Economic Architecture
This section examines the financial structure of major DAOs in 2025, focusing on both treasury composition and protocol revenue distribution. It analyses how onchain treasuries are capitalised, how assets are allocated, and how liquidity is managed across leading ecosystems.
It then evaluates value-capture mechanisms, including buybacks, fee distribution, and the degree to which protocol revenue supports tokenholder or treasury sustainability. Taken together, these elements provide a full picture of the economic foundations and risk profiles DAOs carry into 2026.
Treasury Allocation and Risk
DAO treasuries in 2025 exhibit extreme concentration and structural divergence. While total observable onchain treasury assets across 360 DAOs amount to approximately $12.4B, this capital is overwhelmingly controlled by a small number of entities. The median treasury holds roughly $60k, while the mean stands near $34.5M, highlighting the severity of the distribution skew.
The top 10 treasuries control ~79% of all visible onchain capital, and the top 25 account for more than 92%. As a result, any meaningful assessment of treasury management in 2025 is largely an analysis of a few dozen large treasuries rather than the DAO population as a whole.
This analysis is based on observable onchain balances only. It does not fully capture offchain foundations, banked fiat reserves, endowment structures, or intermediary-managed RWA strategies, which increasingly hold material capital for large ecosystems.
Composition of the Largest Onchain Treasuries
Across the 20 largest onchain treasuries, the average asset mix is approximately 58% native tokens, 14% stablecoins, and 29% other cryptoassets such as ETH and BTC. This average masks sharply different treasury philosophies.
Mantle, Uniswap, Cardano, Optimism, Arbitrum, Fei, and Sky each hold more than 95% of their onchain treasury value in their own token, with minimal stablecoin buffers. In these cases, the treasury functions primarily as a strategic supply reserve rather than a diversified balance sheet, and while offchain assets may partially offset this exposure, they are difficult to independently verify.
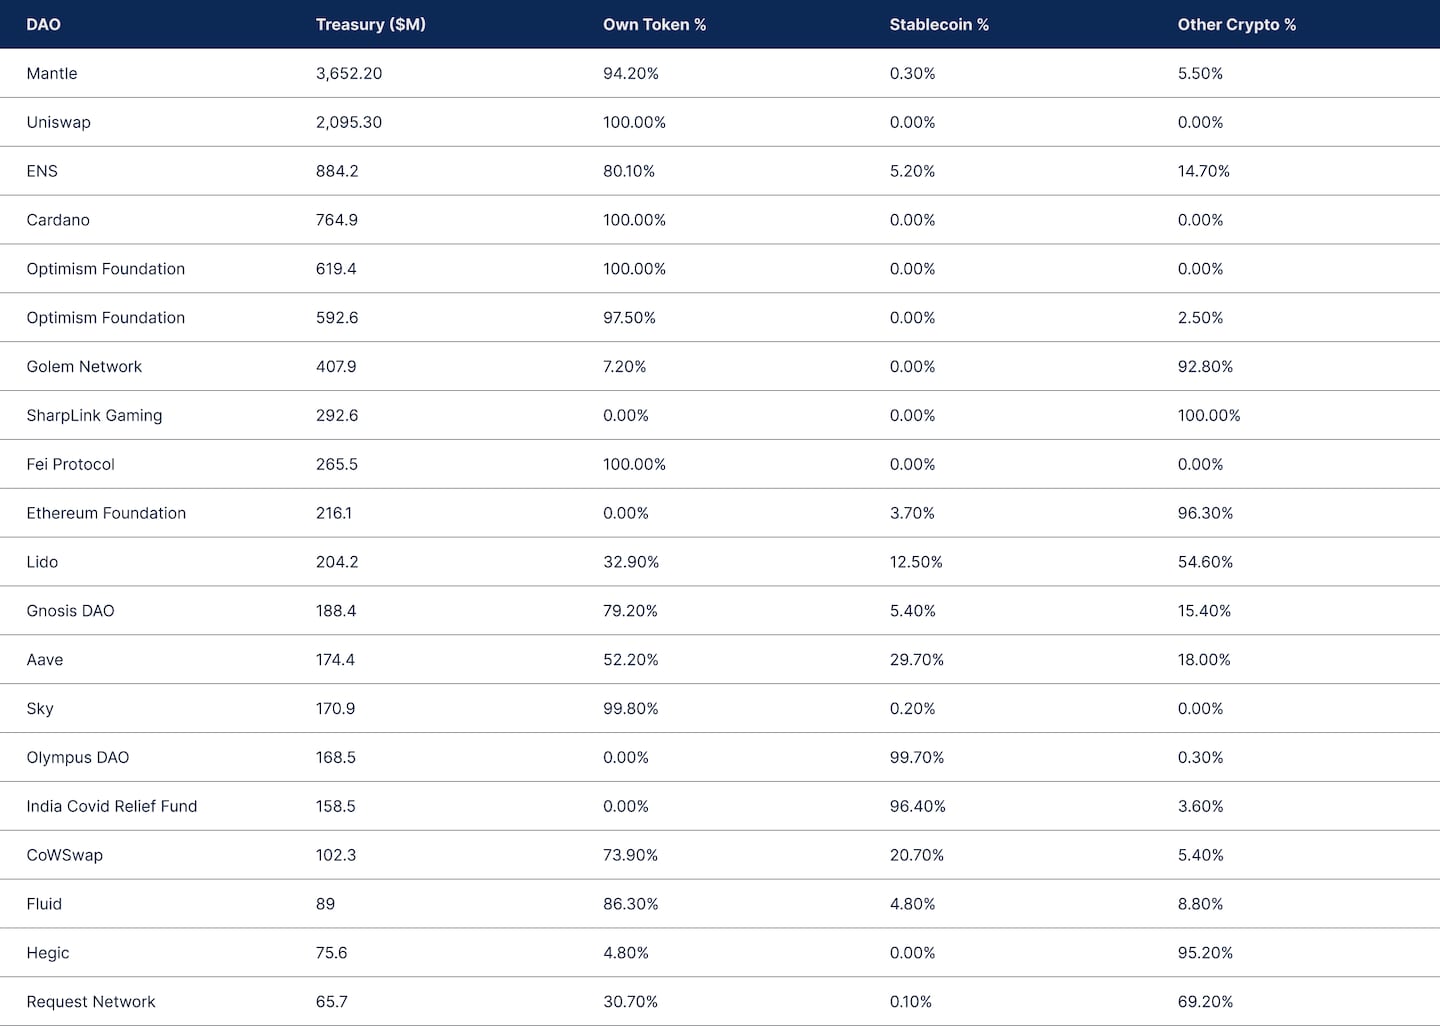
At the opposite extreme, Olympus operates with a near-pure stablecoin treasuries with more than 96% of assets denominated in dollar-pegged tokens. Golem, the Ethereum Foundation, Hegic, and Request Network are dominated by large-cap holdings, primarily ETH, BTC, and diversified token portfolios.
A smaller group reflects a more balanced financial posture. Aave holds ~52% in native tokens, ~30% in stablecoins, and the remainder in other crypto assets. Lido combines ~33% native exposure with over 50% in non-native assets and a double-digit stablecoin allocation. ENS, Gnosis, CoWSwap, and Fluid also maintain meaningful diversification while retaining native alignment. These structures increasingly resemble conventional balance sheets: native tokens as equity-like upside, stablecoins as operating capital, and other crypto assets as strategic or productive reserves.
Among all 360 treasuries, 115 hold more than $1M onchain. Within this subset, 35 hold at least 75% in their own token, while 42 hold at least 25% in stablecoins. This bifurcation defines the current treasury management regime.
Stablecoin Hubs and Liquidity Management
Stablecoins now represent the primary source of working capital for operationally mature DAOs. A small group of treasuries holds a disproportionate share of total stablecoin balances.
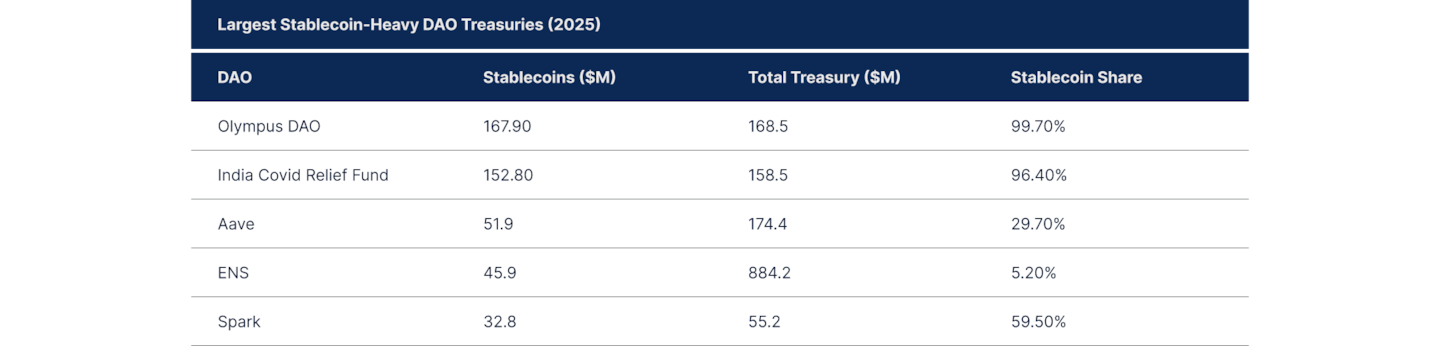
Olympus has effectively completed its transition into a stablecoin-dominated treasury, with ~99% of onchain value in dollar-denominated assets. ENS, Spark, Mango, and Yearn also maintain stablecoin shares above 50%, giving them strong capacity to fund operations without recurring native token sales.
Aave stands out among large DeFi protocols for maintaining a structurally balanced liquidity profile. Roughly one-third of its treasury is held in stablecoins, and nearly one-fifth in non-native crypto assets. This configuration allows Aave to fund contributors and strategic deployments without persistent reliance on AAVE issuance or market selling.
Native Token Concentration and Structural Risk
Native token concentration remains extreme among many of the largest treasuries. Mantle holds over $3.6B onchain with more than 94% in MNT. Uniswap, Cardano, and the Optimism Foundation remain effectively 100% exposed to their own tokens, while Arbitrum exceeds 97% ARB.
Across treasuries larger than $1M, roughly one third still hold at least 75% of assets in their native token. These treasuries function primarily as native supply reserves rather than diversified balance sheets. While this preserves flexibility for grants and incentives, it tightly links operating capacity to token price performance. In market stress, DAOs face a tradeoff between dilutive token sales and declining real purchasing power.
This risk is most acute for lending and RWA protocols that require balance sheet resilience. Treasuries dominated by governance tokens have limited ability to absorb losses or fund prolonged downturns. By contrast, Aave, Lido, Gnosis, Spark, and other diversified treasuries have begun to decouple operations from native token volatility.
Implications for 2026
The 2025 treasury landscape suggests that 2026 will be a year of structural separation between capitalised DAOs and the long tail of treasury-constrained projects. With more than 90% of onchain treasury value concentrated in the top 25 DAOs, the strategic capacity of the sector is becoming increasingly centralised.
In 2026, this concentration is likely to translate into a widening execution gap: well-capitalised DAOs will be able to fund multi-year development, pursue large-scale incentive redesigns, underwrite real-world assets, and absorb adverse shocks, while most smaller DAOs will remain dependent on continual token issuance or external sponsorship to survive.
Treasury composition trends in 2025 point to continued pressure to diversify away from pure native-token balance sheets in 2026, especially for protocols with institutional ambitions. DAOs that remain heavily concentrated in their own token, including some of the largest ecosystems, will face growing scrutiny from counterparties, auditors, and potential TradFi partners.
Stablecoins and productive assets are likely to become the dominant marginal allocation of treasury inflows in 2026. The DAOs that already hold meaningful stablecoin buffers in 2025, such as Aave, Lido, Spark, and Olympus, are structurally better positioned to compound their treasuries through conservative yield strategies, vault participation, and selective RWA exposure
Revenue, Buybacks, and Value Capture
The story of token economics shifted in 2025. For most of the past cycle, DeFi tokens carried large market capitalisations without a clear path for value to flow back to holders.
Governance power and emissions carried the narrative, while protocol revenue often accumulated in treasuries or intermediaries. In 2025, that changed. A growing share of protocol fees was finally redirected to tokenholders, and the market began rewarding those tokens whose economic design translated operating performance into actual financial return.
Across the major protocols tracked during the year, users paid roughly 30.3 billion dollars in fees, up meaningfully from 2024. About 17.6 billion dollars of those fees remained as protocol revenue after paying LPs and suppliers. Most importantly, 3.36 billion dollars made its way to tokenholders through staking rewards, fee sharing, buybacks, or burns. Roughly 58 % of fees become protocol revenue, and 19 % of that revenue is captured by tokenholders.
That is a small share in absolute terms but represents a clear improvement from 2024, when only a fraction of protocols had active value capture. In 2025, meaningful distribution became a standard rather than an exception
Breaking the market into DeFi and non-DeFi categories reveals a more complex picture. DeFi continues to produce most of the ecosystem’s fees but still lags behind chains and other categories in the share of revenue distributed to tokenholders.
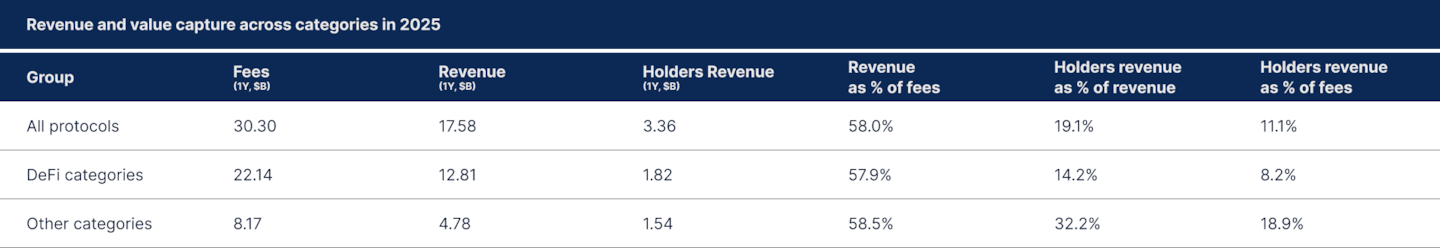
Chains remain the most aggressive distributors of value, with nearly all economic activity ultimately flowing to validators or stakers.
The more interesting shift occurred inside DeFi. A handful of categories matured significantly. Derivatives, CDPs, DEXs, and yield platforms now channel a meaningful portion of their operating surplus to tokenholders. Meanwhile, other categories, including lending, liquid staking, and trading interfaces, still sit much closer to the zero-payout model that dominated 2020 through 2023.
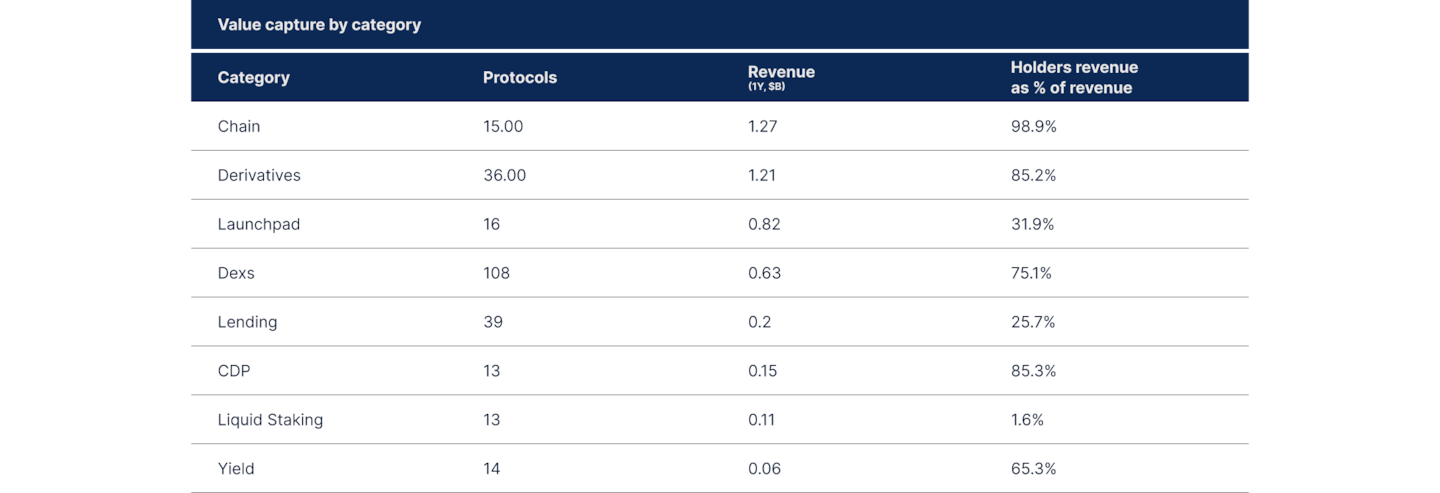
The trend is unmistakable. The protocols that grew most rapidly in 2025, particularly in derivatives and CDP-style lending, adopted explicit value capture as part of their design. In contrast, several of the most established DeFi categories continue to generate large fee volumes without distributing much, if any, value to tokenholders.
Liquid staking offers the clearest example. The economics overwhelmingly accrue to stakers, not governance tokenholders, which explains why governance tokens in the sector still lack a strong cash-flow identity.
The broader market reaction is visible when looking at how many protocols actually share revenue with tokenholders. Nearly 40% distributed nothing in 2025. At the other end of the spectrum, about 40% distributed at least half of their revenue.

The important shift from 2024 is not simply that more protocols activated value capture. It is that the most economically successful protocols of 2025 adopted high-distribution models. It was a year when top-line growth and tokenholder yield began to correlate.
A second theme that defined 2025 is the growing recognition that buybacks on their own are not enough. Many protocols introduced buyback programs during the year, but only the ones that paired them with genuine control of token issuance saw lasting improvements in economic quality. A token that returns revenue through buybacks but simultaneously issues large amounts through incentives is still structurally inflationary.
When viewed holistically, 2025 marked the beginning of a clearer divide in token economics. On one side, structurally sound models that combine revenue sharing with disciplined supply. On the other hand, tokens that still reflect the speculative design of earlier cycles, where governance rights are the only guaranteed utility.
Institutional On-Ramps and Access Structures
The institutional story in 2025 was less about institutions “aping into DeFi” and more about a gradual, deliberate build-out of access rails that fit within existing compliance and risk frameworks. Infrastructure finally reached the point where tokenised funds, permissioned pools, and curated products looked operationally viable for large allocators. Actual allocation remained modest relative to the size of institutional balance sheets, but the architecture for institutional DeFi is now clearly visible.
Two themes defined the year. On the product side, permissioned DeFi and tokenised funds moved from proof-of-concept to commercial scale. On the intermediation side, banks, custodians, and asset managers quietly became the gatekeepers who decide which protocols are suitable as building blocks and which are not.
Permissioned DeFi Products
The main development in institutional DeFi in 2025 was the shift from direct participation in permissionless markets to controlled access points that fit institutional requirements. Most activity flowed through KYC-gated pools, tokenised yield platforms, and structured notes. These formats provided predictable onboarding, defined legal rights, and standardised reporting, which remained difficult to obtain from open onchain markets.
The first major access path was KYC-gated lending markets. Early attempts, such as Aave Arc, demonstrated that adding KYC to an isolated pool was not enough to attract institutional balance sheets. Arc remained effectively unused, holding only tens of thousands of dollars in TVL throughout 2025.
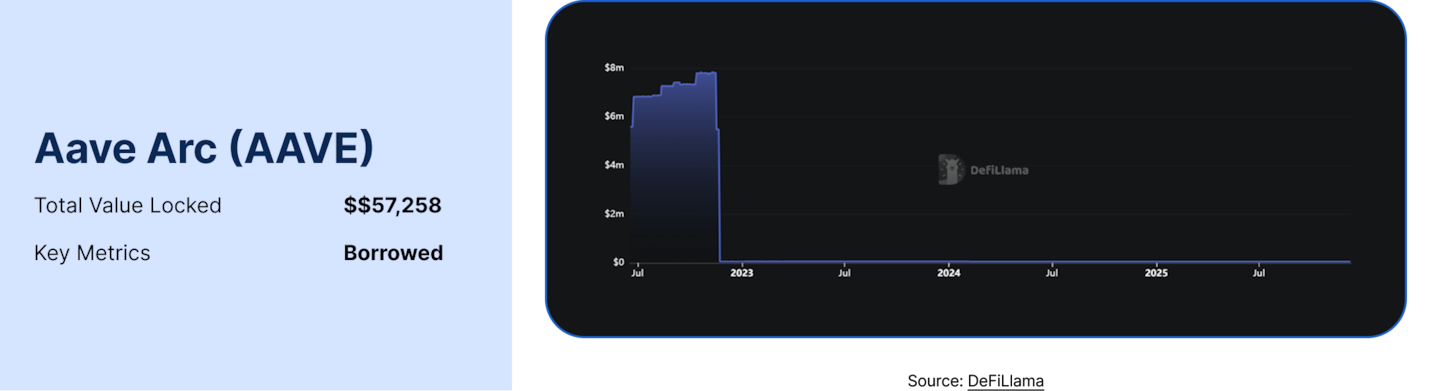
The structure limited both eligible assets and liquidity providers, and offered no clear framework for institutions to treat collateral or counterparty exposure in a way that aligned with existing controls. Aave Horizon, launched in August 2025, adopted a more functional model.
Horizon allowed institutions to borrow stablecoins against tokenised money market and Treasury funds issued by regulated asset managers. These assets were supported by NAV oracles and reserve reporting. Horizon required KYC for collateral providers but allowed a broader base of liquidity on the lending side. The platform now exceeds $300M+ in supplied assets.
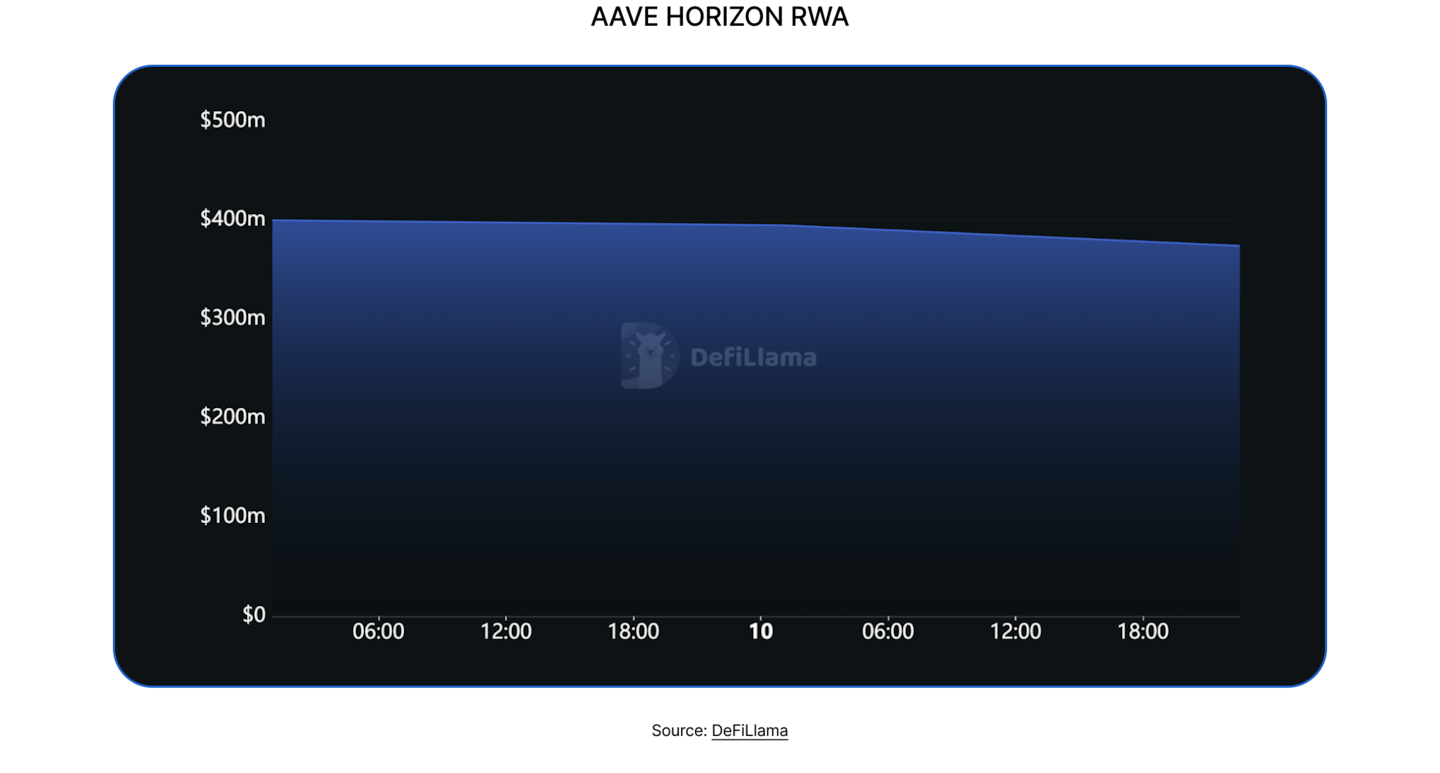
The contrast between Arc and Horizon illustrates that institutions will participate in onchain credit markets when the collateral format and operational structure match established workflows, not simply when an access list is added.
Institutional private credit followed the same logic. Maple Finance reported $1.5B+ active in 2025, with repayment rates above 99%. Maple’s institutional pools rely on KYC, standardised underwriting, and legally defined claims that map assets and liabilities into familiar credit processes while settling positions onchain.
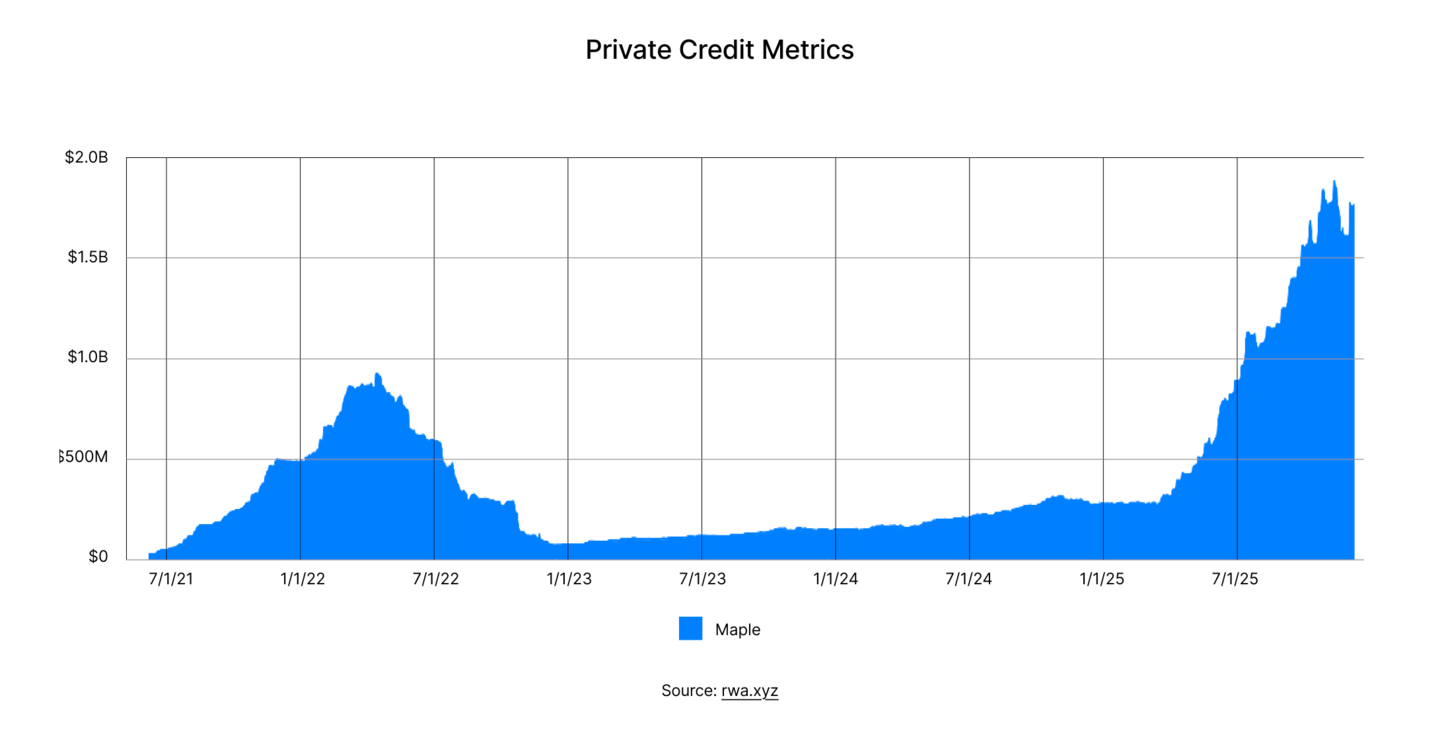
The final access path was structured products linked to DeFi-related returns. Dealers such as Marex reported increasing demand for notes with coupons tied to baskets of BTC, ETH, or systematic onchain yield strategies. Institutions used these notes to access DeFi-like return profiles while maintaining traditional documentation, credit intermediation, and risk reporting. This allowed exposure to be treated like any other yield-linked note within existing product governance.
Across all channels, the pattern was consistent. Institutions did not allocate to raw permissionless pools. They entered through wrappers such as KYC pools, tokenised funds, and structured notes. These wrappers defined what was investable and allowed onchain markets to be integrated into existing operational and regulatory systems.
Intermediaries as gatekeepers
By 2025, institutional access to onchain markets was shaped more by intermediaries than by protocols. Custodians, banks, and asset managers became the effective approval layer deciding which assets and applications institutions could use.
According to the EY–Coinbase Institutional Investor Survey, 86% of institutions already had or planned to add digital-asset exposure in 2025, and 85% increased allocations in 2024. Regulatory clarity was the top driver of further adoption, so institutions approached onchain markets primarily as an infrastructure and compliance challenge.
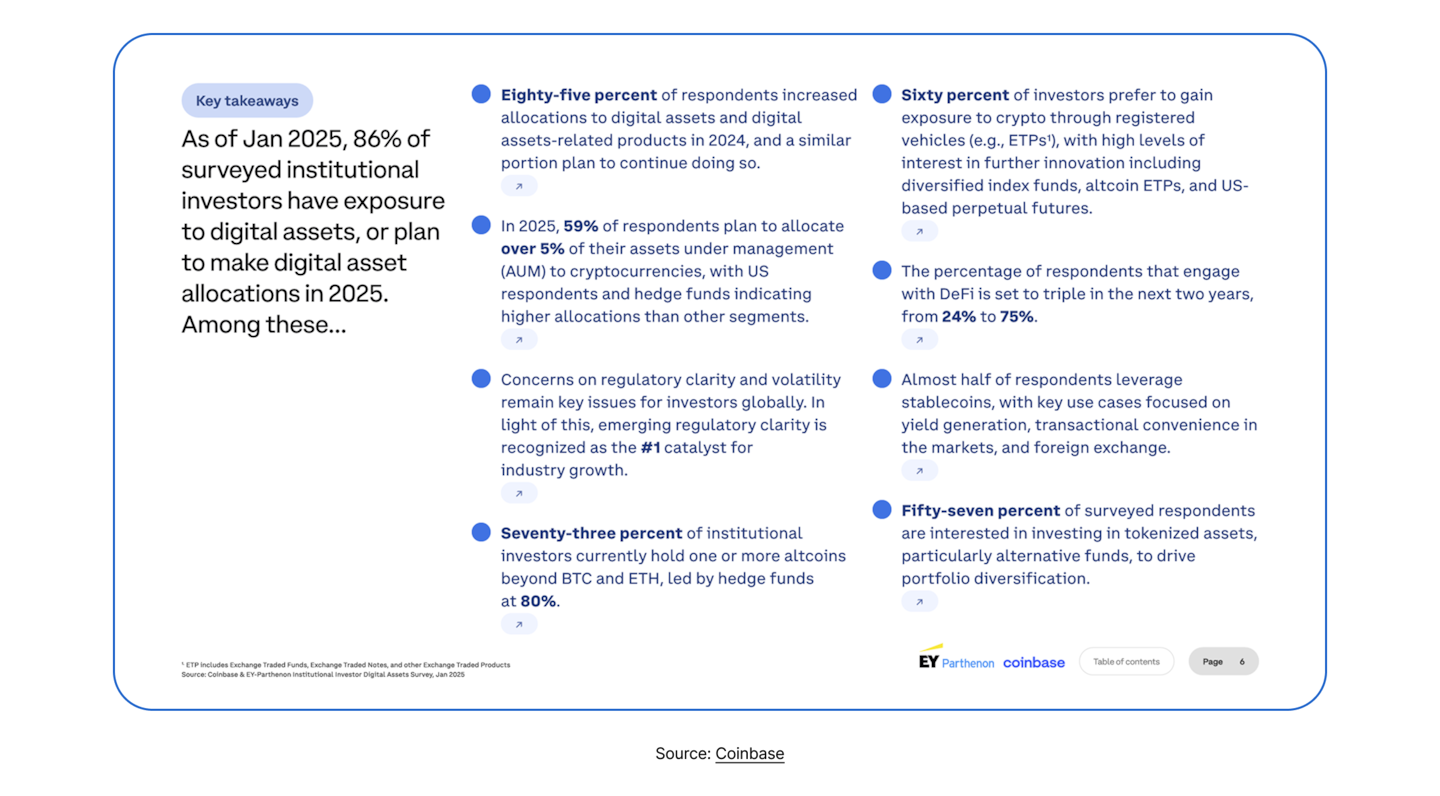
Custody became the first and most binding filter. Institutions evaluated onchain access through the capabilities of their custodians. These included which tokens could be held, which smart contracts could be whitelisted, and which actions such as staking, governance, or lending were operationally permitted. As a result, the investable universe was defined upstream. Protocols without custodian support were effectively inaccessible regardless of their onchain activity, security track record, or revenue generation. In practice, permissionless markets became gated by custody integration roadmaps.
Banks applied the second filter by determining the form onchain exposure could take. Following the 2024 US election, 60% of institutional investors expected increased investor interest, 59% anticipated greater financial-institution participation, and nearly half expected near-term regulatory clarity. Rather than translating into widespread direct DeFi usage, this optimism manifested in bank-led tokenisation initiatives.
Institutions were offered tokenised deposits, tokenised commercial paper, and structured products referencing crypto assets or onchain yields. Client interaction remained fully contained within bank-controlled balance sheets and compliance frameworks, with DeFi protocols operating at most as backend infrastructure.
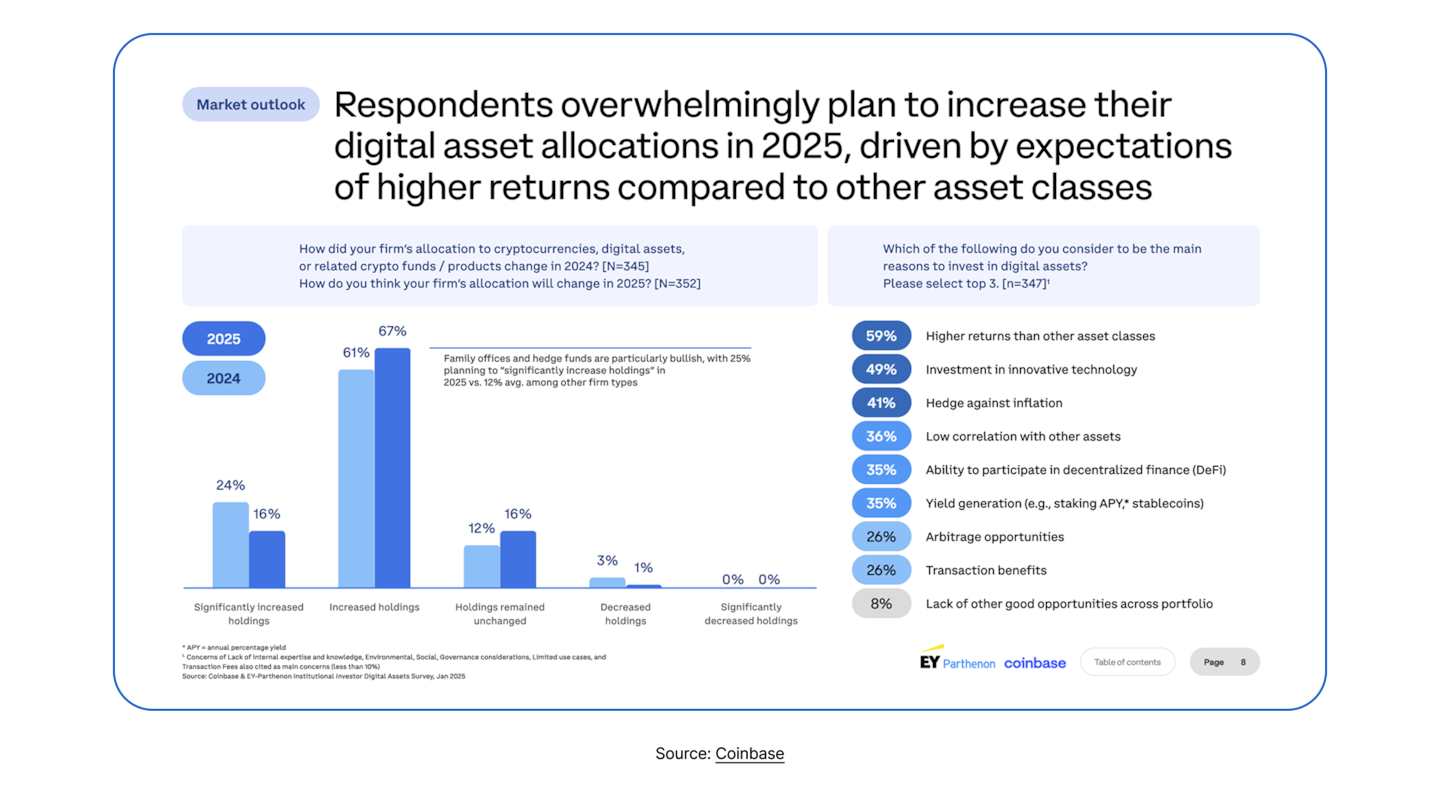
Asset managers imposed the final filter. While 44% of institutions classified crypto as a standalone asset class and 35% cited DeFi participation as a motivation for investing, portfolio inclusion remained highly selective.
Governance rights, liquidity depth, counterparty risk, and value-capture mechanisms dominated allocation decisions. Tokenisation reinforced this conservatism. 57% of respondents expressed interest in tokenised assets, and 65% cited diversification as the primary motivation, signaling a preference for familiar portfolio construction benefits rather than native protocol participation.
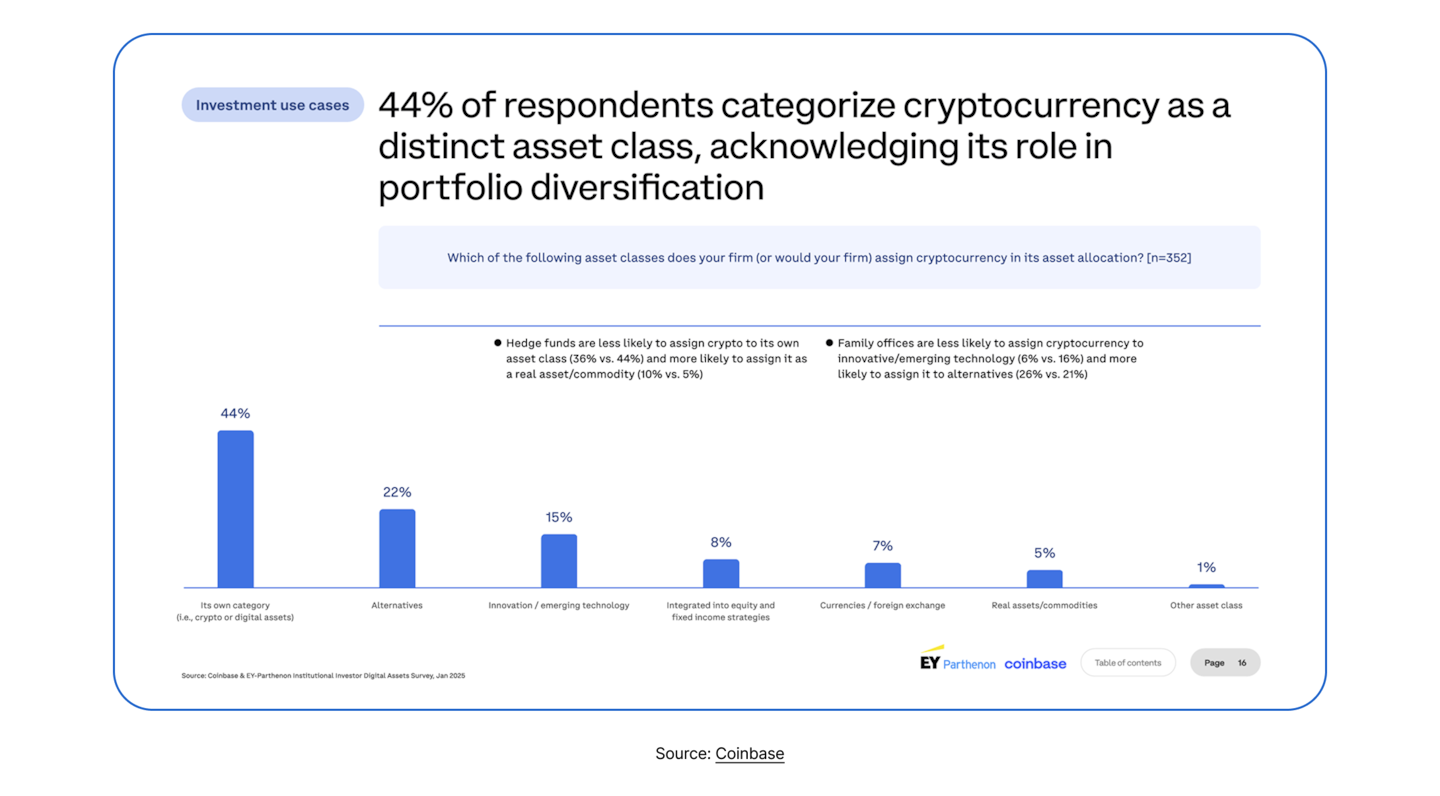
Together, these filters produced a narrow, permissioned pipeline. Institutional DeFi in 2025 was not characterized by direct interaction between allocators and protocols. Custodians determined what was technically accessible, banks determined what was productized, and asset managers determined what was portfolio-eligible. Onchain activity occurred only after clearing all three layers.
Outlook For 2026
2026 looks less like a new narrative cycle and more like a year where a few concrete pressure tests decide which parts of DeFi are durable. The goal is not maximal novelty, it is repeatable adoption under normal conditions, with better execution, clearer risk, and fewer incentive-driven mirages.
Stablecoins move from “growth” to “role separation.”
The big question is not whether supply rises, it is which stablecoins win which jobs: payments and remittances, trading collateral, treasury operations, and yield-bearing cash equivalents. Expect more differentiation by compliance posture, portability, and integration depth, and less tolerance for designs that are hard to redeem or hard to explain.
Rates stop being a free tailwind.
If rates keep drifting down, reserve income compresses. That should force issuers and yield-bearing stablecoin designs to compete on efficiency and distribution rather than headline yield. Watch whether this pushes consolidation among issuers, or pushes new structures that pass through yield while keeping risk legible.
Execution quality becomes the main battleground in trading.
Perps should remain concentrated around execution-first venues, and spot should keep shifting toward intents, RFQs, and solver routing for size-sensitive flow. The differentiator becomes microstructure: spreads, latency, liquidation predictability, and capital efficiency, not branding or chain identity.
Collateral mobility becomes the real scaling constraint.
As liquidity spreads across specialized venues and app-chains, the “winner” is often the system that makes collateral portable and margin efficient without adding fragile trust assumptions. If portability improves, the trading stack can feel unified. If it does not, fragmentation becomes the ceiling.
Credit and yield get judged on quality of carry, not TVL.
In lending, watch whether growth is driven by repeat borrower demand and sustainable utilisation, or by passive deposits. In yield markets, watch whether duration exposure and fixed-rate primitives become more treasury-native, and whether structured yield concentrates systemic risk around a small set of underlying mechanisms.
RWAs compete on integration, not novelty.
Tokenized Treasuries and money-market products should remain the base layer of “onchain cash collateral.” The adoption gate is operational: custody support, NAV oracles, redemption mechanics, and integrations into lending, treasury frameworks, and exchange rails. If rates fall, credit performance and reporting quality matter more than simply offering spread.
Restaking faces an explicit risk premium test.
With slashing and real penalties, restaking either evolves into a fee-bearing security layer that pays for complexity, or it continues consolidating as marginal capital refuses to take uncompensated risk. Watch whether AVS fees become meaningful, and whether consolidation accelerates.
Market integrity becomes the hidden systemic risk.
Private routing and solver execution can improve outcomes, but they also concentrate order flow and reduce transparency. Watch for growing attention from regulators and market participants on conflicts, disclosure, and dependence on a small number of intermediaries, even without “DeFi-specific” rulemaking.
Token design and treasuries separate the durable from the noisy.
2026 should widen the gap between protocols that can finance themselves and those that still rely on emissions. Watch for more explicit value capture paired with tighter issuance discipline, and for treasury diversification toward stablecoins and productive assets as DAOs prepare for longer operating runways.
Digital asset treasuries enter a post-flywheel regime.
The model likely persists, but the easy phase, where premiums stay high and capital raises are automatically accretive, is no longer guaranteed. Watch whether the space compresses into a small set of credible vehicles, and whether yield-enabled ETH treasury models can sustain premiums without becoming fragile financial engineering.
The system is scaling, but scaling turns design tradeoffs into structural realities. In 2026, the winners are likely to be the protocols and rails that can handle that shift without losing the properties that made DeFi compelling in the first place.